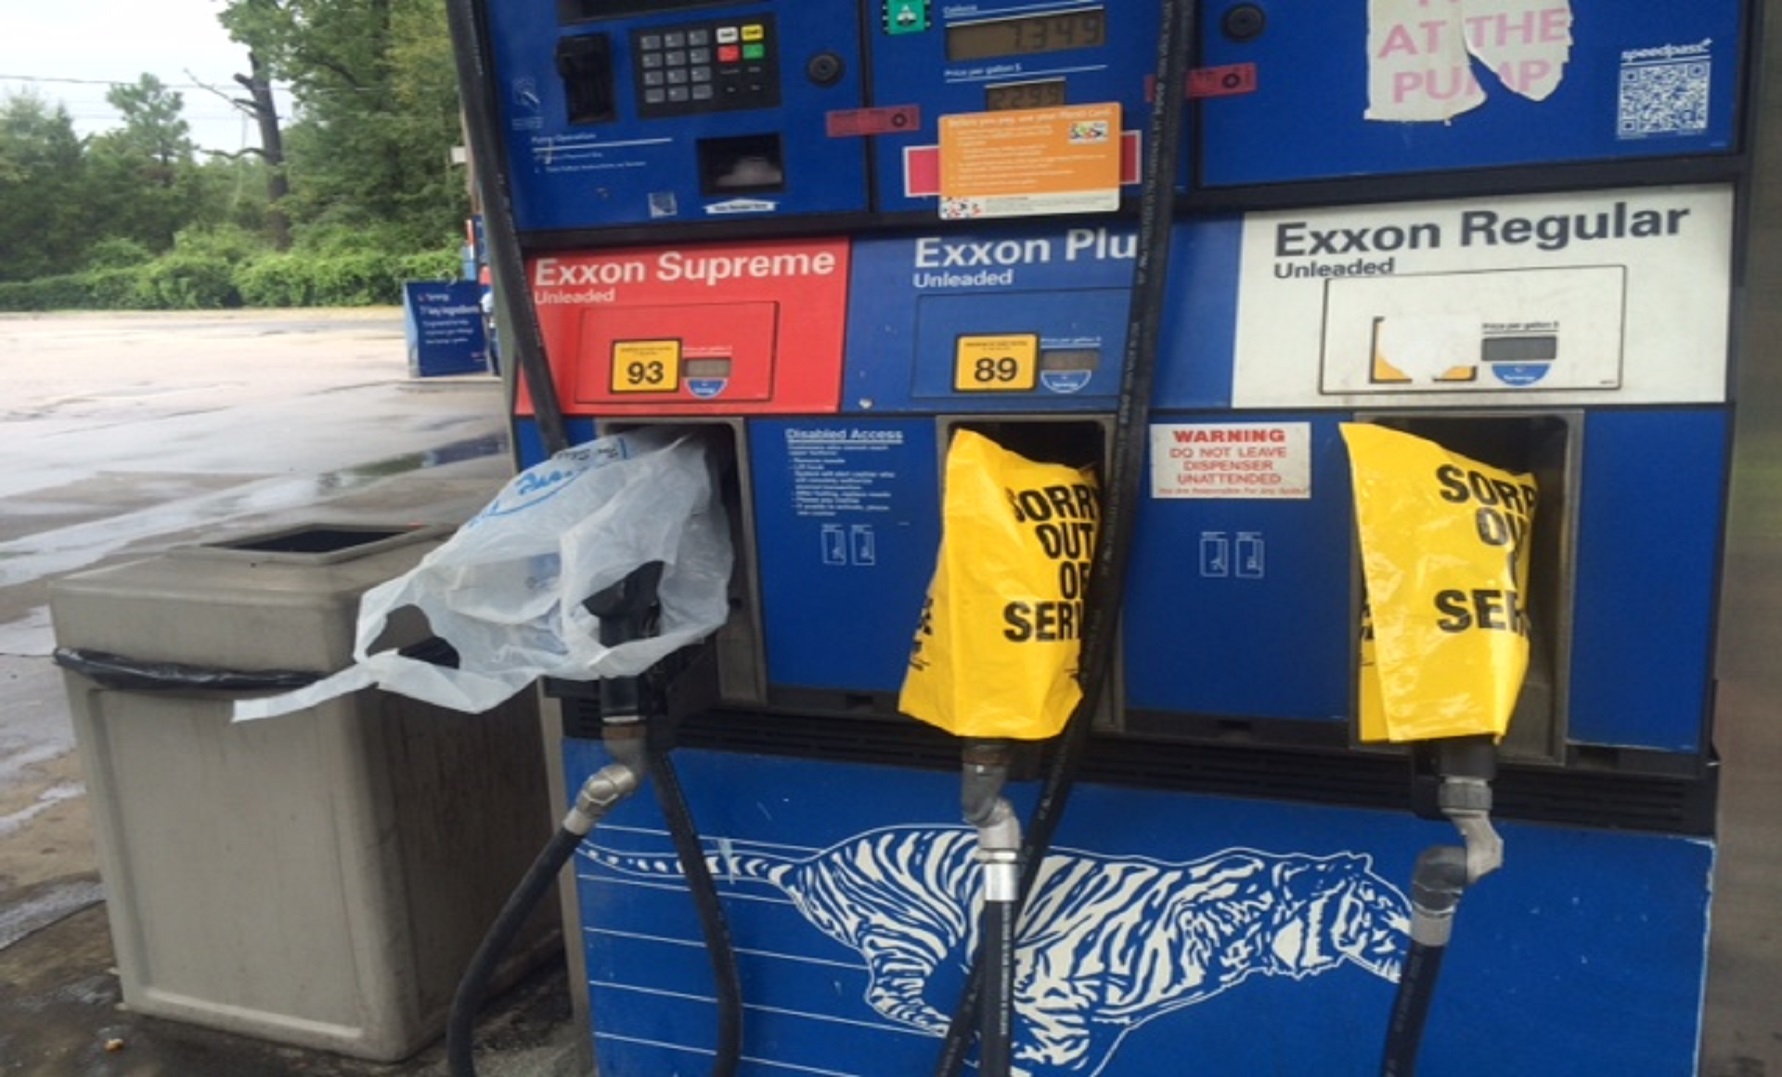
I live in North Carolina. Since Sunday there have been long lines at gas stations; that is if they have gasoline to sell. On September 9th a leak was discovered in a major pipeline carrying gasoline from the refineries in the Gulf States to Linden, New Jersey. Between 252,000 and 356,000 gallons of gasoline have leaked. The pipeline was shut down, but repair was delayed a few days for safety reasons. The pipeline, owned by Colonial Pipeline, Inc. is the largest in the United States and serves 40 percent of the market on the eastern seaboard. Governor McCrory told us in a news conference Tuesday, "North Carolina is currently receiving one-third of our normal supply of fuel." Fortunately, a bypass pipeline opened today, but a normal supply of fuel is not expected to reach our area until late this week or early next week according to
The News and Observer, Raleigh, North Carolina's primary paper.
This is a great example of a current event that can be introduced in the classroom to teach the basic laws of supply and demand.
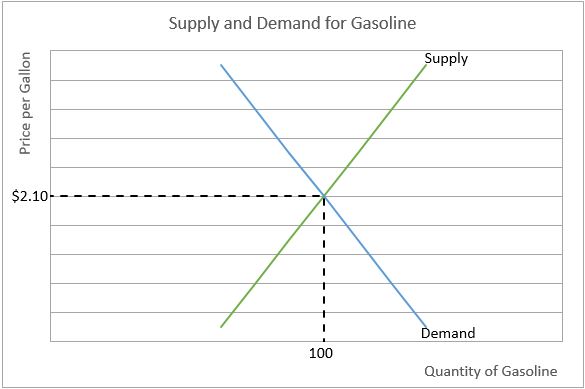
Graph 1 is the basic supply and demand curves for gasoline before the fracture. The average price in my neighborhood was $2.10. I do not know the equilibrium quantity but assume it is 100. (Think of it as an index where 100 percent is the normal equilibrium quantity.)
Graph 1
Following the fracture, the supply decreased. The supply curve for gasoline shifted to the left (from S
1 to S
2). As expected, there was a shortage, which is the difference between the quantity demanded point B and the quantity supplied point A. Evidence of the shortage was the long lines that developed. This was further aggravated by people, like me, who filled up all of their vehicles as a precautionary measure even when they had over half of a tank already in each vehicle. This is indicated by an increase in the demand for gasoline from D
1 to D
2, which increased the shortage. I am going to assume this short-term increase in demand was minimal. As expected, lines got longer and the price increased. In my area the price jumped to approximately $2.20. Graph 2 shows these shifts.
Graph 2
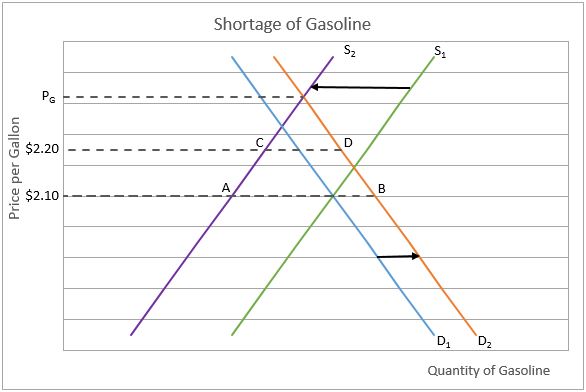
Note that a shortage remained. On our graph the shortage after the price increase is the distance between points C and D. Price gouging laws prevented vendors from raising their prices much higher. As expected, gas lines continued into the week. The long lines and the ability to charge more indicates that the equilibrium price is higher. Several vendors did increase their price. In one case a station charged over $4.00 a gallon. Graph 2 shows that the new short-term equilibrium price would equal PG if price gouging were not illegal. Fortunately, Colonial fixed the pipeline so it is back in operation. We expect the shortage will persist for just a couple more days. At that time the supply and demand should return to normal. To learn more about using supply and demand as an analytical tool visit our eleven lessons related to
supply and demand. Each lesson includes text, interactive exercises, at least one video, review questions, and a related scripture lesson.
A long-run issue remains. Unfortunately, we can expect more of these types of incidents in the future as our infrastructure ages. (The broken section of Colonial's pipeline was constructed in 1963.) Proposed pipelines such as Kinder Morgan's pipeline between Jacksonville Florida and South Carolina and the Keystone XL pipeline in North Dakota have run into numerous problems. Understandably, many people do not want the pipeline in their neighborhood.
A good summary article can be found at
ABC News.