State of the Economy - April 2018
The US economy remains healthy. The economy grew at an annual rate of 2.3% during the first quarter of 2018. Payrolls increased for a record of 90 straight months, and inflation remained low. The fiscal stimulus of lower tax rates should continue to fuel growth. But how long can the growth last, and what if anything should be done to prevent inflation from increasing?
Economists differ on the
full employment rate. Up to this rate, the economy can sustain growth without adding a great deal of inflationary pressure. Above it, businesses are at capacity and workers can bid up wages. Companies raise prices since they have difficulty increasing production. Until recently, economists considered an unemployment rate less than 5% to be inflationary. But inflation has remained in check and December 2015 was the last time the US unemployment rate was 5.0% or higher. Why hasn't there been more inflation? The increase in payrolls are indicative of an increasing demand. Conventional wisdom would conclude that wages should increase. However, many who have not worked in a long time are returning to the labor force, increasing the supply of willing workers. The US low labor participation rate and historically high U-6 rate mean many Americans have chosen to not seek work. These workers are not included in the official U-3 unemployment rate. As wages and job prospects increase many of these workers have chosen to return.
Expect the Federal Reserve to raise the target federal funds rate a minimum of two more times in 2018, particularly if the unemployment rate drops further. Added income and a higher demand for workers must eventually fuel inflation. The current expansion is one of the longest. It will eventually end. When it does, the Federal Reserve will want to have room to lower rates. At the current target federal funds rate of 1.50% there is little room to lower rates if
expansionary monetary policy is needed.
Note – Just prior to publishing this post, the Bureau of Labor Statistics published the Employment Situation Report for April. The unemployment rate dropped to 3.9%.
Real Gross Domestic Product (RGDP)
The
BEA released its advanced estimate of the
real gross domestic product (RGDP) last Friday. (
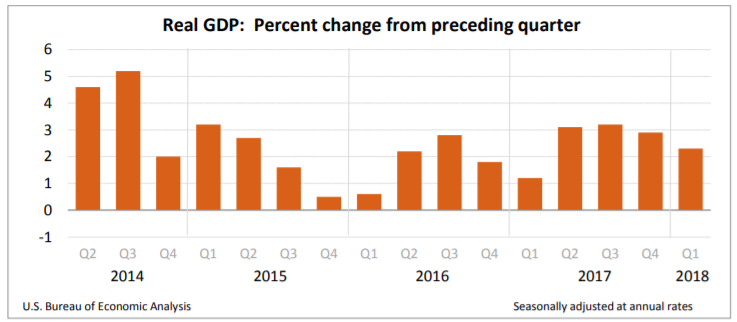
BEA News Release April 27, 2018) As mentioned in the above summary, the US economy grew at an annual rate of 2.3 percent during the first quarter of 2018. Growth slowed from a pace of 2.9% in the fourth quarter of 2017. Why? The main reason is consumers slowed their pace of spending. Consumer spending comprises approximately 2/3rds of the economy.
Personal consumption expenditures (PCE) grew at a torrid pace of 4.0% at the end of 2017. It would be unusual for the economy to maintain that pace. PCE only grew at 1.9% in the first quarter. This can partially be explained by the destructive weather in the second half of 2017 which forced families to pay for repairs and automobiles, causing the sharp increase in the purchase of durable goods at the end of the year. (Spending on durable goods increased 13.7% in the last quarter of 2017, and fell 3.3% in first quarter of 2018.)
Families are beginning to see less tax withheld from their paychecks which increases their disposable income. Disposable income increased 3.4% compared to 1.1% in the last quarter of 2017. It is a bit puzzling that consumer spending fell as much as it did, given the increase in disposable income. Real disposable income increased 3.4% in the first quarter compared to 1.1% at the end of 2017. The savings rate increased from 2.6% to 3.1%. Should we worry about the deceleration of spending?
The Federal Reserve will likely put little weight in these figures. If anything, they will view them as being positive. Growth figures are normally low in the first quarter. 2018’s figure is the highest first quarter growth rate since 2015 due to a statistical anomaly known as the “residual seasonality”. The BEA has made some adjustments and acknowledge that the seasonable adjustments can be misleading in the first quarter.
Visit our free lesson,
Gross Domestic Product – Measuring an Economy’s Performance, if you would like to learn more about the GDP.
Personal Income and Outlays
Consumers earned and saved more in March according to the
BEA’s Personal Income and Outlays report released on Monday. Personal income increased $47.8 billion or 0.3%. Wages and salaries increased 0.2%. It is worth noting that this follows increases of 0.4% in February and 0.5% every month between November 2017 and January 2018. What caused the slowdown? The deceleration of wage growth is most likely the result of a deceleration of the growth in the economy’s
aggregate demand. As we will see later in the employment section this also contributed to fewer people being added to payrolls.
All of February’s income and outlay figures were revised downward. Personal and disposable incomes were each reported to increase 0.4% in February. The BEA now believes they only increased 0.3%. The biggest drop was in personal consumption expenditures. It was revised from 0.2% to 0% in February. These figures are consistent with the surprising drop in PCE in the BEA’s advanced estimate of RGDP which was discussed above. Most economists believe the deceleration of spending is not a trend, and the March jump in consumer spending supports that belief.

The price level fell in March. The
PCE price index fell from 0.2% in February to 0.0% in March, largely because of a drop in energy prices. The more important
core price index remained at 0.2%. For the past twelve months prices have increased at 2.0%. Prices excluding food and energy rose 1.9%. The PCE price index is favored by the Federal Reserve, making it more important than the more commonly used consumer price index when evaluating
monetary policy. The Federal Reserve’s target is 2.0%.
Most contracts that are tied to inflation use the
consumer price index. Unlike the consumer price index, the PCE price index accounts for changes in spending behavior as the price of a good increases or decreases. For example, the weight given to chicken would increase if consumers substitute chicken for beef following an increase in the price of beef. The consumer price index compares items in a “basket” of commonly used goods and services. The measure assumes no change in the basket contents.
Consumer Price Index
Don’t be fooled by the low inflation rate for the month of March. The Bureau of Labor Statistics released its latest report on April 11. March prices decreased 0.1%, but the fall was largely due to the 4.9% drop in gasoline prices. Even with March’s fall in gas prices, the gasoline index was up 11.1% for the past 12 months. The volatility of energy and food prices explains why economists prefer the core price index, particularly when monitoring changes from month to month. The core index remained unchanged at 0.2%. For the past 12 months prices have increased 2.4%. The core index has increased 2.1%, the most since February 2017.

Another indication that the drop in March prices is short-lived is the increase in the
produce price index. It jumped 0.3% in March following a 0.2% increase in February. The PPI measures inflation for suppliers. It is the weighted average cost of a basket of goods and services sold in the wholesale, manufacturing, and commodity markets. The PPI is a leading indicator and frequently signals future changes in the CPI. Businesses may try to pass some of their cost increases (which is measured in the PPI) through to the final buyer (which is measured in the CPI). Visit
BLS – Producer Price Index for the most recent report.
Most indicators continue to point to higher prices in the coming months. Even gasoline prices increased in my neighborhood in May. The labor market will continue to tighten, and wages should continue to rise. Consumer spending will continue to increase as incomes rise, which will increase aggregate demand. A weaker dollar will continue to increase commodity prices. (This is one reason the PPI has increased for the last 12 months.) A trade war, and the added cost of tariffs will be passed through to consumers as higher prices. (See blog –
President Trump’s Proposed Tariff – The Economics.)
Employment
Employers added 103,000 jobs in March, according to April’s job report from the
Bureau of Labor Statistics. This is down from the robust 326,000 in February, but still marks a record 90 straight months of employment gains. The unemployment rate has remained at 4.1% for the past six months. Broader measures of employment, such as the U-6 rate fell. U-6 decreased from 8.2 in February to 8.0% in March. It includes
“total unemployed, plus all persons marginally attached to the labor force, plus total employed part time for economic reasons, as a percent of the civilian labor force plus all persons marginally attached to the labor force” (
BLS Table A-15). Average hourly wages increased 2.7% to $26.82.
Why did the number of new employees drop so much? First, 326,000 is an exceptionally high number, and 103,00 is closer to the norm. Lower consumer spending results from a deceleration in the growth of the economy's aggregate demand. Another possibility is employers are taking a wait and see attitude following the suggested tariffs and possible trade war that became more evident in March. This is particularly true in the manufacturing area where a trade war would have the greatest impact. Manufacturers added 22,000 jobs in March. In The Wall Street Journal’s Heard on the Street column,
Why Trade Feud May Hurt Job Growth, Ken Brown wrote:
The evidence for that is most clear in employment by goods producers, which was up just 15,000—compared with a gain of 106,000 in February—largely because of a 15,000-job decline in construction hiring. It is no coincidence that builders use lots of aluminum and steel, though they also were hit by weather. While goods producers are a smaller part of the economy than the service sector, they had been big drivers of job growth in recent months after choppy gains last year.