State of the Economy - August 2018
The US economy continues to extend its near record expansion and is showing few signs that growth will slow down soon. The
BEA increased its estimate of growth in the second quarter from 4.1 to 4.2%. Unemployment remained at 3.9% in August, which is close to its lowest rate in the past 50 years. Wages continue to grow, although the pace slowed. August price increases were less than in July.
The
FOMC, the committee that sets monetary policy for the Federal Reserve, is expected to increase the
federal funds rate when it meets September 25th and 26th. This would be the third of an expected four increases in 2018. Why would the Fed increase rates when the economy is performing so well? It fears the economy is overheating and cannot sustain its current pace, without causing too much inflation. The FOMC would like to slow the rate of growth to a more sustainable level by increasing interest rates. Higher rates reduce the
aggregate demand by increasing the cost of purchasing items such as homes, vehicles, or equipment.
Why do economists fear an overheated economy? When an economy's production reaches its
long-run aggregate supply, or capacity, increases in the aggregate demand result in more inflation than an increase in output. Recently I have chatted with several business owners of service companies. They told me they have reached capacity. They would like to hire more workers but are having trouble locating and hiring qualified employees. Several told me they are not accepting jobs or discouraging buyers by raising their prices. When an economy's long-run aggregate supply is reached, businesses increase their prices because they are unable to accommodate the added work. Many companies have reached or are nearing their production capacity. Capacity utilization now exceeds 78% according to research published by the Federal Reserve Bank of St. Louis. (
FRED) Inflationary pressure will continue to escalate as the economy approaches 80% capacity.
Fiscal policies will continue to fuel economic growth. Changes in the tax law have provided consumers and businesses with more money to spend. Federal spending increased 3.7% in the second quarter. All of these increase the economy's aggregate demand and result in demand-pull inflation.
Improvements in productivity are the key to prolonging the good news about the economy. In a revised report published September 9th, the
Bureau of Labor Statistics reported that productivity increased 2.9% in the second quarter, more than any quarter since 2015. Productivity improvements reduce the average cost to produce a good or service. For example, unit labor costs fell 1% since last August. Productivity gains make it possible for businesses to raise their capacity, pay their employees more, while minimizing price increases. Tax benefits included in the
Tax Cuts and Jobs Act passed in December 2017 and a tight labor market will continue motivating many businesses to increase their productivity by replacing some of their workers with machinery.
Real Gross Domestic Product (RGDP)
The BEA published its second estimate of the US economy’s second quarter growth. For a full report visit
BEA News Release August 29, 2018. The report’s main points include:
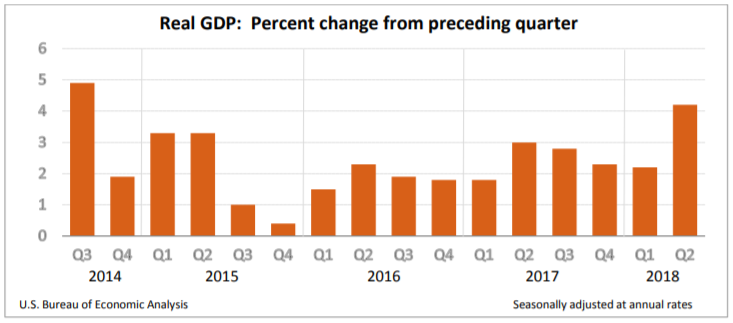
- Real gross domestic product (RGDP) grew 4.2% in the second quarter, which is the fastest pace since the third quarter of 2014.
- Consumer spending was up 3.8%
- Real gross domestic income increased 1.8% following a 3.9% increase in the first quarter.
- Profits rose at a slower clip in the second quarter but were up over 16% from a year ago.
In its recent news release, the BEA revised its estimate of economic growth for the second quarter from its Advance Estimate of 4.1% to 4.2%. This is a sharp increase from 2.2% growth in the first quarter of 2018.
The economy's primary drivers during the second quarter were increases in consumer spending, business investment and government spending. Growth in consumer spending is vitally important because 2/3rds of economic activity falls into this category. In the second quarter consumer spending increased 3.8%. This was revised downward from 4.0% but remains healthy.
Businesses continue to spend more. Changes in the tax law that went into effect at the beginning of the year which lowered corporate tax rates also permit companies to write off capital investments much faster. These changes seem to have provided the intended incentive to invest in fixed assets. Nonresidential fixed investment increased 8.5% in the second quarter. This follows an 11.5% increase in the first quarter. However, the bad news is that growth in after-tax business profits slowed in the second quarter from 8.2% to 2.4%. However, to put this in perspective, profits are 16.1% higher than a year ago. (See Table 9 of the BEA report)
Government spending has continued to increase. For the past three quarters, federal spending has increased 4.1, 2.6. and 3.7%. This compares to a less than 0.5% average quarterly increase in 2016. Government spending contributes to economic growth by adding to a country’s aggregate demand.
(Read Fiscal Policy – Managing the Economy By Taxing and Spending.)
Real gross domestic income (RGDI) only increased 1.8%. Theoretically, RGDP and RGDI should be equal because a purchase by one person is income for the seller. In the first quarter RGDI grew at 3.9% compared to RGDP growing at 2.2%. Many economists believe the average of RGDI and RGDP is a more accurate portrayal of growth. In the second quarter the average grew at 3.0% compared to 3.1% in the first quarter. (For a more detailed explanation of the relationship between an economy’s production and income visit
Gross Domestic Product – Measuring an Economy’s Performance.)
Personal Income and Outlays
The BEA published
Personal Income and Outlays - July 2018 on August 30th. The highlights include:
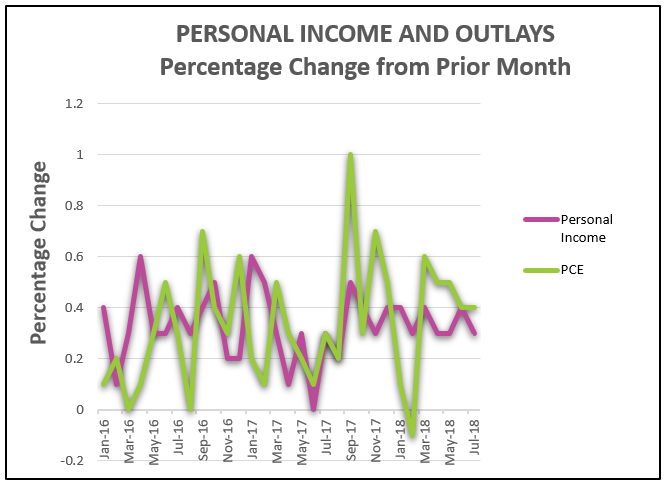
It appears the tax cuts are working. Disposable income, which is income after taxes, has increased more than 0.3% every month since January when the reduced tax rates took effect. Consumers have more money to spend and they are spending it, which is helping to extend the economy’s expansion. Personal consumption expenditures increased at the same 0.4% pace in July as it did in June. This follows increases of 0.6% in March and 0.5% in April and May.
Wage growth continues to be encouraging because earnings are beginning to exceed inflation. Real disposable personal income grew 2.5% over the prior twelve months.
Inflation as measured by the PCE Price Index remains near the Fed's benchmark of 2.0%. In July, the PCE price index equaled 0.1% and 2.3% for the prior 12 months. More importantly, the
core price index, which is considered more reliable, increased 0.2% in July and 2.0% since August 2017. Both measures have increased since the beginning of 2018.
Consumer Price Index
The BEA and the Bureau of Labor Statistics (BLS) have separate measures of inflation, the PCE price index (BEA) and the CPI (BLS). The primary difference is the BLS measures the increase in the cost of identical baskets of goods and services in different periods. It does not account for people substituting one good for another following the price change of one good. For example, if the cost of beef increases, consumers may purchase more chicken. The BEA’s measure accounts for these changes. The Federal Reserve favors the PCE price index. However, the CPI is more widely followed because it is published first. (For a more detailed discussion of the differences in methodology between the BLS and BEA visit
Inflation.)
On September 13th, the BLS published its August
Consumer Price Index Report. The highlights are:
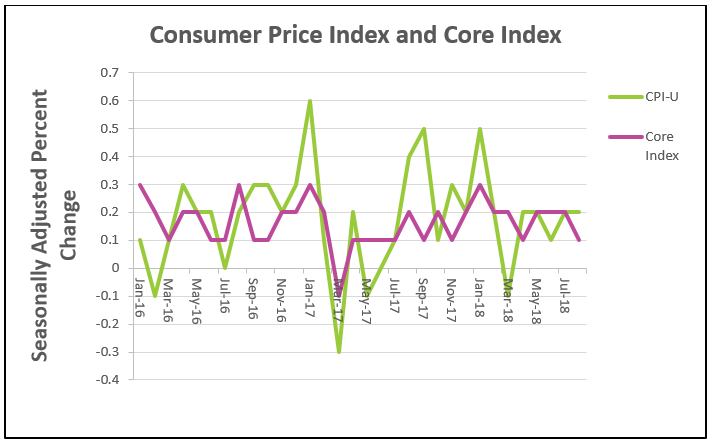
- The Consumer Price Index for All Urban Consumers (CPI – U) increased 0.2% in August and 2.7% over the past year.
- The rate of increase in the core index fell from 0.2% in July to 0.1% in August.
- Shelter and gasoline prices increased substantially.
The most common measure of inflation, the CPI – U, increased 0.2% in August, matching the increase in July, but the rate of increase has slowed from 2.9% to 2.7% when measuring it over the prior 12 months. The core price index increased 0.1% in August down from 0.2% in July. For the past 12 months the core index has increased 2.2%. Many economists believe a core index is a more reliable measure of inflation when identifying trends because it excludes volatile food and energy prices.
Two unavoidable costs (for most families) had large increases – gasoline and shelter. Gasoline prices rose 3.0% in August and over 20% during the prior 12 months. This means that if it cost you $30 to fill your car tank in July, it now costs $30.90. Worse, if you paid $30 last August, it now costs $36! The cost of shelter, which accounts for approximately 1/3rd of consumer spending, increased 0.3% in August and 3.4% over the past 12 months.
In a separate report, on September 12th, the BLS reported that producer prices have increased 2.8% since last September. However, it also reported that the
producer price index fell 0.1% in August, which is the first monthly decrease since February 2017. (Visit the BLS full report at
Producer Price Index News Release.) Changes in producer prices frequently foreshadow changes in the consumer price index because it measures the change in the cost to produce goods and services, which can later be passed through to consumers. However, students should look at trends over several months before reaching a conclusion.
Employment
On September 7th the BLS published
The Employment Situation for August. Here are the highlights.
- 2001,000 workers were added to payrolls in August.
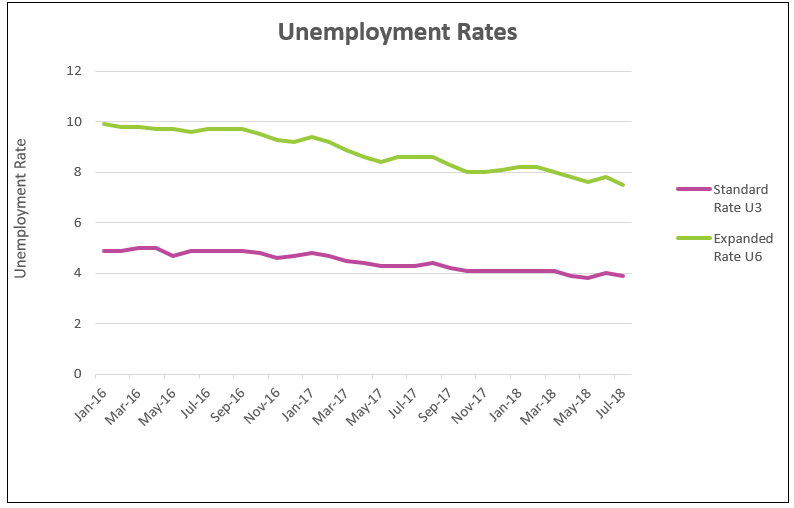
- U – 3 remained at 3.9%.
- U – 6 fell from 7.5% to 7.4%, the lowest it has been since April 2001.
- Employment gains were broad based, with the exception being motor vehicle construction, where 5,000 fewer workers were employed.
- Hourly earnings increased an average of $0.10 to $22.73.
201,000 people were added to nonfarm payrolls in August. All measures of unemployment remain low. The standard measure of unemployment, the U – 3, held steady at 3.9%. Tight labor conditions are helping some part-time employees find full-time work as evidence by the small drop in U – 6 to 7.4%. The BLS defines the U – 6 as the “total unemployed, plus all persons marginally attached to the labor force, plus total employed part time for economic reasons, as a percent of the civilian labor force plus all persons marginally attached to the labor force.”
Earnings increased in August. The average hourly earnings equaled $27.16, up 10 cents from last month for private nonfarm workers. Wage increases were wide-spread. Only employees in utilities experienced a drop in earnings. The overall average has increased 2.9% or 77 cents from last September. (See table B-3 of BLS Employment Report.)
The labor participation rate, which is the percentage of the non-institutionalized population who participate in the labor force (employed and unemployed), fell from 62.9 to 62.7% in August. This is partially explained by teenagers returning to school since teens experienced the largest decrease in August. However, economists believe this trend will continue as baby boomers retire and drop out of the labor force. Companies have recently become more innovative in attracting workers who may have remained on the sidelines. For example, Tesla, Electric Boat and CVS have expanded their internships.
Boeing is recruiting many former employees who recently retired. (See The Wall Street Journal – August 13, 2018)