State of the Economy - July 2018
The US economy is growing at 4.0%. Unemployment fell to 3.9%. Inflation is approximately 2%. All of the economy's vital signs are excellent. Even workers are beginning to benefit. Wages have increased 2.8% since last year and appear to be gaining momentum as the labor market tightens. The expansion is now the second longest recorded.
I am sorry to report that this prosperity will not last forever. Business cycles are a fact of life. What will spoil the party? Inflation…. I expect inflation to jump to 3% in the foreseeable future – especially if the economy continues to grow more than 3% annually.
Many companies are nearing their
capacity. Capacity utilization has been increasing for the past two years and has reached approximately 78% according to research published by the Federal Reserve Bank of St. Louis. (
FRED) Most economists believe inflationary pressure will increase as companies near 80% capacity. Many service companies are also reaching their capacity. In recent conversations I have had with business owners they are very busy, but express concern about their inability to accommodate the added work because they have had trouble locating and hiring qualified workers. Many businesses are raising their prices to discourage the additional work.
Fiscal stimuli will continue to bolster the economy’s
aggregate demand, which causes
demand-pull inflation. Changes in the tax law have stimulated growth. Consumers and businesses have more money to spend. Federal spending continues to grow. Spending has increased an average of 3.4% per quarter during the past three quarters. This compares to an average increase of 0.14% since the first quarter of 2014. (Read
Fiscal Policy – Managing the Economy By Taxing and Spending to learn more about the relationship between fiscal policy and inflation.)
Tariffs are inflationary. President Trump has imposed tariffs on imports. Other countries have retaliated by taxing American goods. (See blog –
President Trump’s Proposed Tariff – The Economics.) Prices of imports should begin to increase because the cost of tariffs will be passed on to buyers of imports. This includes goods manufactured domestically that contain imported materials, such as steel and aluminum. (To learn more about the impact on tariffs see our free lesson
Supply and Demand – The Costs and Benefits of Restricting Supply.)
The Federal Reserve is likely to become more concerned an overheated economy will be inflationary. Its response will be to continue raising interest rates. Higher rates increase the cost of purchasing items such as homes, vehicles, or equipment. The effect should be to slow the economy. Most economists expect two more increases in the
federal funds rate before the end of the year. I expect the next increase will be announced following the
FOMC’s meeting September 1st.
What could prove me wrong? An improvement in
productivity would enable the economy to continue growing with minimal inflationary pressure. Tax benefits and a tight labor market will motivate many businesses to invest in equipment to replace some of their workers. The
Tax Cuts and Jobs Act passed in December 2017 allows businesses to immediately write off equipment if purchased within the next five years. In its August report, the
BLS reported that productivity is improving. Productivity improved 2.9% in the second quarter which is the largest gain since 2015. Hopefully the trend will continue and extend the current expansion with minimal inflation!
Real Gross Domestic Product (RGDP)
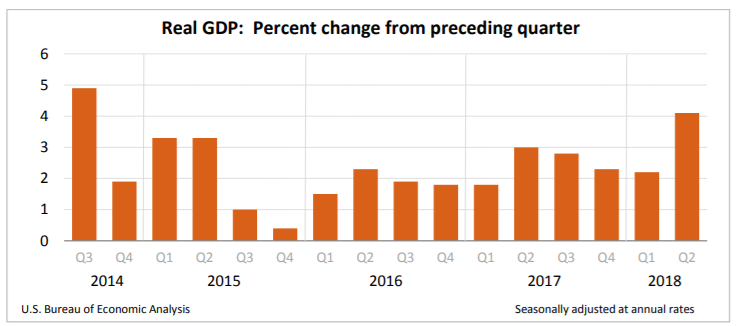
Economic growth accelerated in the US in the second quarter of 2018 according to recently reported figures by the
Bureau of Economic Analysis. The nation’s
real gross domestic product (RGDP) grew 4.1% in the second quarter. That is up from 2.2% in the first, and the highest since the third quarter of 2014. The current expansion began in June 2009 and is now the second longest expansion recorded. Only the ten-year expansion between March 1992 and November 2001 is longer. (The
National Bureau of Economic Growth) RGDP equals the market value of all final goods and services produced within a country in a given period after being adjusted for inflation. It is the most used measure of the size and growth of an economy. (
BEA News Release July 27, 2018) Recently the expansion has been fueled by tax cuts, an increase in government spending, rising employment, and rising incomes. The recent report is the BEA’s “advance estimate” for the second quarter. The Bureau stresses that the figures will be revised in the next three months.
Consumer spending is probably the most important driver of an economy because it normally comprises 2/3rds of total spending. Families have more to spend, and they are spending. Lower tax rates, larger paychecks and a positive outlook have all contributed to growth in consumer spending. Consumer spending, or
personal consumption expenditures (PCE) rose 4% in the second quarter. This follows a small 0.5% increase in the first quarter. (Note: The 0.5% increase is unusual for the past few years. Apart from last quarter, quarterly increases have ranged between 1.6% and 4.7% since 2014.)
Exports of goods increased a whopping 13.3% and contributed 1.06% to last quarter's increase in RGDP. Most economists believe the bump is temporary. Foreign buyers increased their inventories of US goods before tariffs are imposed by the US and other countries. For example, US soybean exports nearly doubled from a year ago. Paul Kiernan, a reporter for
The Wall Street Journal, reported on July 6th, that US farmers normally export soybeans between September and December. However, Chinese buyers wanted to purchase soy beans before China’s 25% retaliatory tariff went into effect. Tariffs increase the price of imported goods. For an economic analysis visit our lesson
Supply and Demand – The Costs and Benefits of Restricting Supply.
Businesses continue to spend more. Changes in the tax law that went into effect at the beginning of the year have lowered corporate tax rates and allow companies to write off capital investments much faster. These changes seem to have provided the intended incentive to invest in capital. Nonresidential fixed investment increased 7.3% in the second quarter. This follows an 11.5% increase in the first quarter.
Government spending has continued to increase. For the past three quarters, federal spending has increased 4.1, 2.6. and 3.5%. This compares to an average of less than 0.2% between 2014 and 2017. Government spending fuels economic growth by adding to a country’s aggregate demand. Visit our free lesson,
Gross Domestic Product – Measuring an Economy’s Performance, if you would like to learn more about the GDP.
Personal Income and Outlays
Finally - wages are up. It has been over ten years since wages increased 0.4% in a month. The BEA reported that both gross and
disposable personal income increased 0.4% in July in their monthly report,
Personal Income and Outlays. The
Bureau of Labor Statistics reported separately that wages and salaries have increased 2.8% in the past 12 months. This is the largest gain since 2008.
Personal consumption expenditures, or consumer spending, continues to be strong. It increased 0.4% in June following increases of 0.6% in March and April and 0.5% in May. (These figures were revised upward.) It appears as if the tax cuts are working. Disposable income has increased more than 0.3% every month since January when the reduced tax rates took effect. Consumers have more money to spend and they are spending it, which is helping to extend the economy’s expansion.
Inflation was been gaining momentum since January. Last month inflation was the highest it has been since early 2012, but June’s inflation was slightly lower when measured by the PCE price index. The BEA reported that prices increased 0.1%, down from 0.2% in May. The reduction was not enough to reduce the rate for the last 12 months, which remained at 2.2%. More importantly, the core index, which excludes volatile energy and food prices, increased .01% in June. The price level has increased 1.9% over the past twelve months. The Federal Reserve’s target is 2.0%.

Consumer Price Index
Inflation is at the highest level since 2012. The
consumer price index rose 0.2% in July and 2.9% for the past 12 months. In June prices increased 0.1%. (
Bureau of Labor Statistics – Consumer Price Index Summary.) The big movers in July were airline fares, up 2.7%, medical care, down 1.7%, shelter, up 0.3% and energy, down 0.5%.
The BEA and the Bureau of Labor Statistics have separate measures of inflation. The primary difference is the Bureau of Labor Statistics report compares the monthly cost of identical baskets of goods and services. Its greatest criticism is that it does not account for people substituting one good for another following the price change of one good. For example, if the cost of beef increases, consumers may purchase more chicken. The CPI assumes the same amount of meat and chicken would be purchased. The BEA’s measure accounts for changes in consumer spending patterns. The Federal Reserve favors the BEA’s PCE price index. However, the Bureau of Labor Statistics's CPI index is more widely followed because it is published first every month. (Note the above discussion for the PCE price index was for prices in June, and the CPI discussion is for July. The BEA has not released its July report.)
July's CPI report contained some bad news for workers. While workers continue to enjoy higher wages, their real average hourly earnings fell. This means inflation is absorbing any increase in hourly earnings. (Bureau of Labor Statistics Table A-2) The average worker is receiving a larger paycheck but paying even more for the same basket of goods than one month ago. The core index, which excludes volatile food and energy prices increased 0.2% last month and 2.4% over the past twelve months. It is lower because it does not include the dramatic increase in energy prices during the past twelve months. Energy prices have jumped 12%, largely because gasoline prices are 25% higher than a year ago.

Unemployment
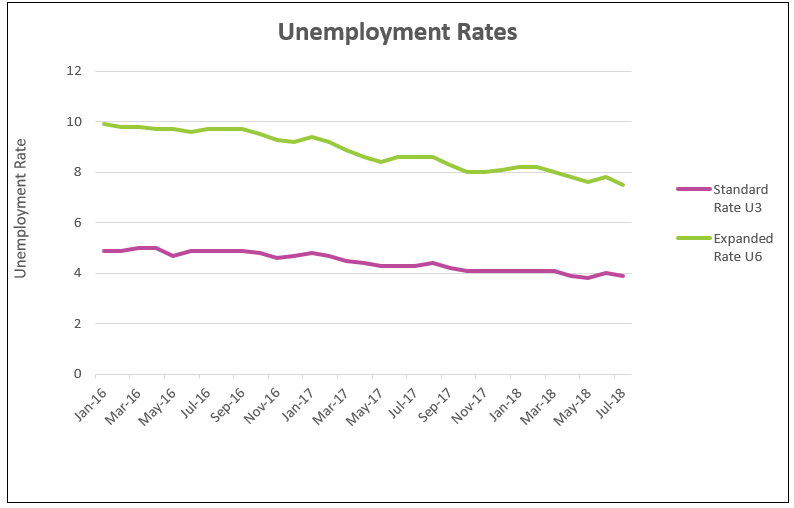
The Bureau of Labor Statistics reported that the unemployment rate decreased to 3.9% in July from 4.0% in June. (
BLS – Employment Situation – July 2018) Payrolls increased by 157,000 workers. Fewer people returned to work in July than in any month in the past year. U-6, the broadest measure of unemployment, fell from 7.8% to 7.5%. The U6 rate includes “total unemployed, plus all persons marginally attached to the labor force, plus total employed part time for economic reasons, as a percent of the civilian labor force plus all persons marginally attached to the labor force”.
Companies are seeking creative ways to add qualified workers. Many such as CVS and Tesla are using vocational training as reported in
The Wall Street Journal on August 13, 2018. Another sign of a strong labor market is employers are hiring more people lacking a high school diploma. Unemployment of this group has dropped from 7.0% a year ago to 5.1% in July.
Job growth may slow soon. Many economists are concerned the growing trade war will slow economic growth. Tariffs will increase the price of goods and services, which should reduce the economy’s aggregate demand. The Federal Reserve is beginning to push interest rates higher, which should slow home sales and car purchases.