State of the Economy - June 2018
The US economy remains healthy and growing stronger. The economy grew at 2.0% in the first quarter and most economists believe growth will exceed 3% in the second quarter because the fiscal stimulus of lower tax rates should fuel continued growth. Payrolls have increased for a record of 93 straight months, but consumers are beginning to lose purchasing power. The Bureau of Labor Statistics reported that earnings of “production and nonsupervisory employees” increased 2.7% over the past 12 months. During the same period, the inflation rate equaled 2.9%, which means these employees have seen a drop in their purchasing power. Why has wage growth been so stubborn? Payrolls are increasing, but so is the number of unemployed. It appears that many who remained on the sidelines are returning to work. The participation rate increased last month to 66.2% to 66.5%.
Keep an eye on exports next quarter. The trade war is heating up and this will impact the economy. Exports will decline as countries retaliate from the
tariffs imposed by President Trump. Prices of imports should begin to increase because the cost of tariffs will be passed on to buyers of imports. This includes goods manufactured domestically that include imported materials such as steel and aluminum. Exporting companies may experience a decrease in the price of their products if countries retaliate by imposing their own tariff. The tariff will increase the price of an imported good in the country that imposes the tariff. This means that American goods will be more expensive in countries companies export to if they charge a tariff. This will cause a drop in the
quantity demanded for US goods. This has been seen in the decrease in prices of many agricultural goods. (To learn more about the impact on tariffs see our free lesson
Supply and Demand – The Costs and Benefits of Restricting Supply.)
Real Gross Domestic Product (RGDP)
The
Bureau of Economic Analysis (BEA) revised its estimate of growth in the first quarter downward yet again. The BEA published its third estimate for the growth in the
real gross domestic product (RGDP) on June 28th and revised its growth estimate to 2.0% in the first quarter of 2018. This is the second downward revision. In April its advance estimate was 2.3%. The RGDP equals the market value of all final goods and services produced within a country in a given period and is adjusted for inflation. It is the most used measure of the size of an economy. (
BEA News Release June 28, 2018) This follows an increase of 2.9 percent in the last quarter of 2017. Why the slowdown in growth? The main reason is consumers slowed their pace of spending. Consumer spending comprises approximately 2/3rds of the economy.
Personal consumption expenditures (PCE) grew at 0.9% in the first quarter, which is the smallest increase in five years after rising 4% in the last quarter of 2017. This can partially be explained by the destructive weather in the second half of 2017 which forced families to pay for repairs and automobiles.
Should we be concerned? Probably not. It is important to note that we are currently in the beginning of the third quarter. This report is for the first quarter of 2018. Other reports in this blog indicate the economy improved during the second quarter. I expect the BEA’s second quarter reports will conclude that GDP has grown at a faster clip than the first quarter. The initial report for the second quarter is due at the end of July. All indicators point to a much more robust second quarter. In its July 26th forecast,
GDPNow estimated a second quarter growth of 3.8%. GDPNow is published by the Atlanta Federal Reserve Bank. It is an unofficial estimate of GDP based on current information and the model used by the BEA.
The real gross domestic income increased 3.6% in the first quarter following an increase of only 1% in the fourth quarter. Higher earnings and lower tax rates should generate economic growth in the second quarter.
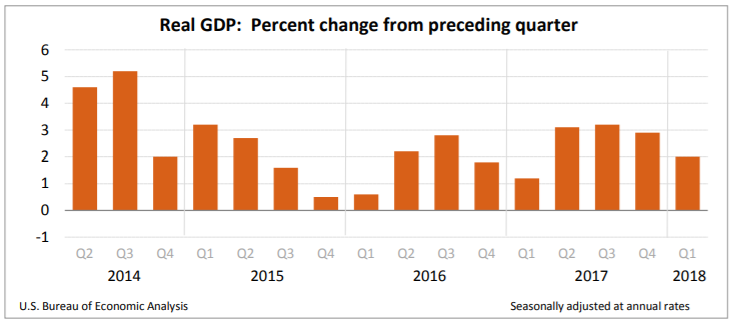
Corporate profits have increased 6.8% over the last twelve months. The after-tax profits jumped 16.9%. Corporations are benefiting from the lower tax rates that were established in January. Visit our free lesson,
Gross Domestic Product – Measuring an Economy’s Performance, if you would like to learn more about the GDP.
Personal Income and Outlays
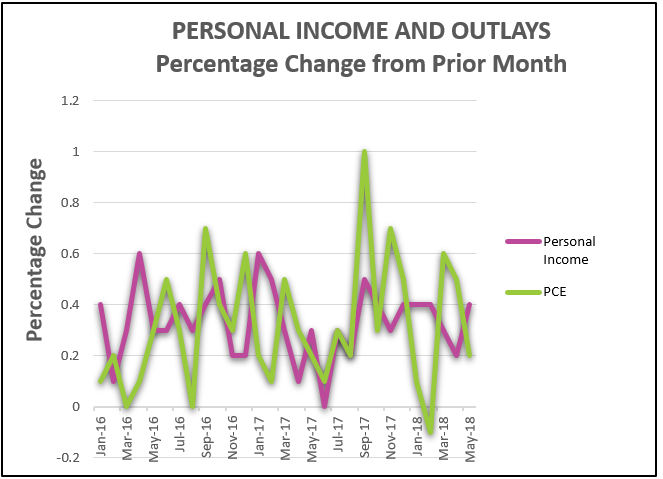
Growth in personal expenditures slowed, but personal income increased in May, according to BEA’s
Personal Income and Outlays report released June 29th. Not surprisingly savings increased. Consumer spending started the 2nd quarter with dramatic increases following a poor showing at the end of 2017. But the pace slowed from 0.5% in April to 0.2% in May. Income increased at approximately 0.4% a month in May, up from 0.2% in April. Given the increase in income and the lower pace of spending, it is not surprising that the savings rate increased from 3.0% to 3.2% in May.
Consumer spending accounts for approximately 66% of GDP, so the slower spending rate may indicate that economic growth is decelerating. Real income (income after adjusting for inflation) has not kept pace with inflation. (See discussion in the inflation section of this blog.) I believe this is not the beginning of a trend and a tighter labor market will continue to pressure wages, ultimately resulting in wage increases that exceed inflation. Growth in real income will propel increases in consumer spending and economic growth.
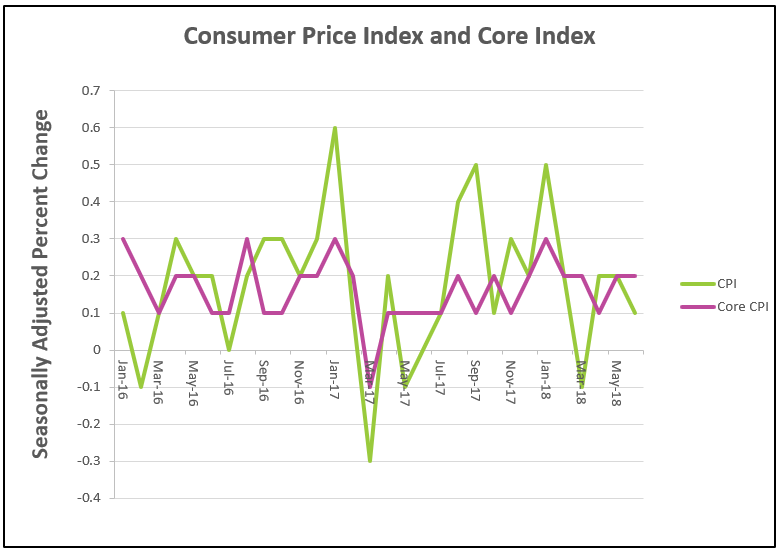
Inflation is the highest it has been since early in 2012. As the economy has prospered and wages have increased, it is not surprising that the price level has continued to rise. Prices, as measured by the (
PCE price index) increased 0.2% in May. Over the past twelve months prices have increased 2.3%, up from 2.0% in April. More importantly, the
core price index, which excludes volatile energy and food prices, increased .02% in April and 2.0% over the past twelve months. The Federal Reserve’s target is 2.0%, so it is likely the Fed will continue to gradually increase interest rates.
Consumer Price Index
Good news – wages are continuing to increase. Bad news – inflation has absorbed the earnings increase. The Bureau of Labor Statistics released its latest two reports on July 12th. Inflation is heating up, and wage increases are not keeping pace. For the past twelve months prices have increased 2.9%, the largest increase since 2012. During the same period wages for “production and non-supervisory employees” have increased 2.7%. This means the
real wage, the wage after accounting for inflation, has decreased 0.2% so the average worker is receiving a larger paycheck but paying even more for the same basket of goods than one year ago. The year-long core index increased 2.3%. The core index is lower because it does not include the dramatic increase in energy prices during the past twelve months. Energy prices have jumped 12%, largely because gasoline prices are 24% higher.
The rise in energy prices slowed in June. During the month, seasonally adjusted energy prices decreased 0.3%, because gasoline prices only increased 0.5% in May compared to 1.7% and 3.0% in April and March. Electricity prices fell 1.4%. The core index rose 0.2% for the second month in a row. The increase in the CPI has been dominated by the energy sector for most of the year. However, recent increases in the cost of health care and housing indicate that price increases are becoming more wide-spread. I expect this trend to continue if the trade war escalates because many domestic manufacturers will pay more for items such as aluminum and steel they use in the production process. These costs will be passed through to consumers. (For example, the cost of washing machines increased 13% since June of last year.) In addition, imports purchased directly from foreign producers will cost more. (See blog –
President Trump’s Proposed Tariff – The Economics.) This may be partially offset by a deceleration of the increase in gasoline prices. Typically, gas prices increase more in the summer months when the demand for fuel increases. In addition, the prices of some exports may decrease if the demand for the export drops following tariffs imposed by importing countries in retaliation to the US tariffs. For example, the prices of many agricultural products have decreased since the trade war began.
To read the full CPI report visit
BLS – CPI. For the earning report visit
BLS Real Earnings Summary.
Employment
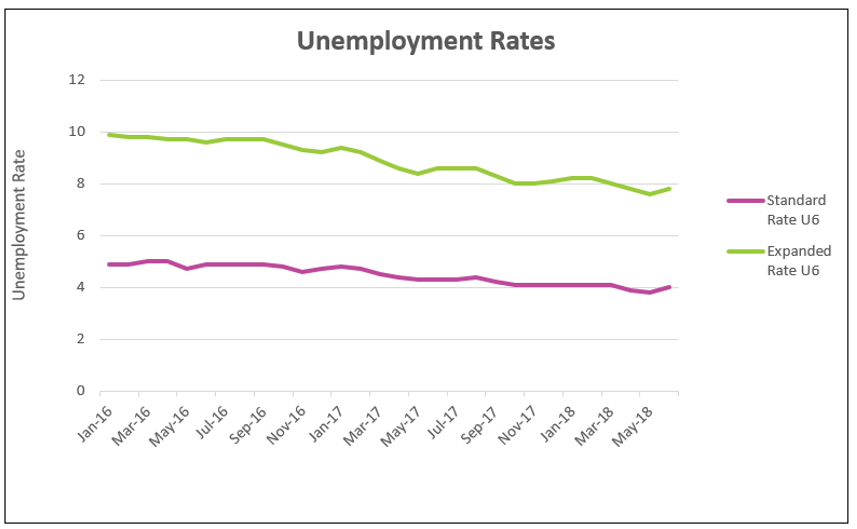
The unemployment rate increased to 4% in June from 3.8% in May. It is still lower than a year ago when it was 4.3%. Payrolls increased by 213,000 workers – but the number unemployed increased 499,000. How can the number of employed increase and the unemployment rate increase? Americans are returning to work. A person is only considered unemployed when he or she is seeking employment. The improvement in the economy has prompted many to reenter the labor market. This is evident by the increase in the participation rate from 66.2% in May to 66.5% in June. The economy has supported a growing workforce for the past 93 months. The broader U6 unemployment rate which includes workers who want to work full-time but accept part-time positions also increased from 7.6% to 7.8% last month.
Job growth may slow soon. Many economists are concerned the growing trade war will slow economic growth. Tariffs will increase the price of goods and services, which should reduce the economy’s
aggregate demand. The Federal Reserve is beginning to push interest rates higher, which should slow home sales and car purchases. Follow the link to the
BLS – Employment Situation – June 2018.
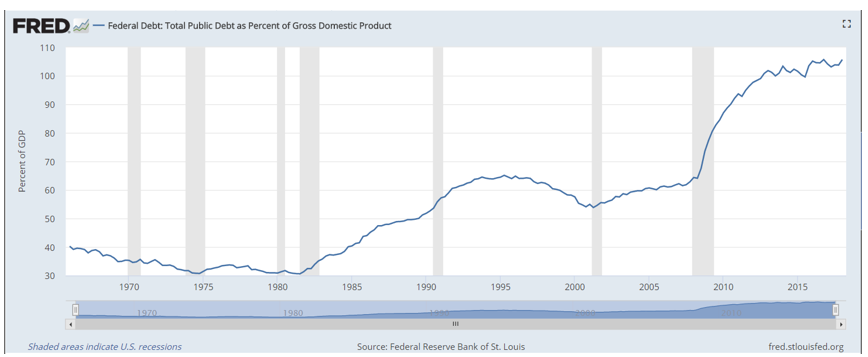
National Debt
The Federal Reserve Bank of St. Louis reported on June 28th that the US federal debt exceeded the nation’s gross domestic product by 5.7% at the end of the first quarter in 2018. This is up from 3.7% in the fourth quarter of 2017. What does this mean? The best measurement for a debt’s affordability, whether it is a family purchasing a new home, a business, or a country, is the relationship between debt and income. The US national debt now exceeds its income and the trend is becoming more alarming. In 2017, Germany’s ratio was approximately 64%, and the UK’s was 88%. Countries that recently had financial problems had higher debt ratios. Greece was estimated at 179% and Italy’s debt ratio equaled 132%. In 2016, Japan's debt to GDP ratio was a whopping 236%. The large debt is one reason the Japanese have had minimal growth for over a decade. Source:
CountryEconomy.com). To learn more about the US national debt read our free lesson
The Federal Budget and Managing the National Debt. The lesson includes an interactive exercise to help students appreciate the challenge of balancing the budget.
Source:
FRED
