State of The Economy - May 2019
The May economic reports indicate that the US economy continues to thrive, although some economists fear the expansion is near its peak and threatened by the trade wars. Many of this group believe expansionary monetary policy is appropriate to prolong the expansion. There appears to be little risk that an overheated economy would fuel too much inflation. President Trump concurs. His tweets continue to urge the Federal Reserve to lower rates. Review summaries of these important government reports and read my analysis at the end of this blog.
Real Gross Domestic Product (RGDP)
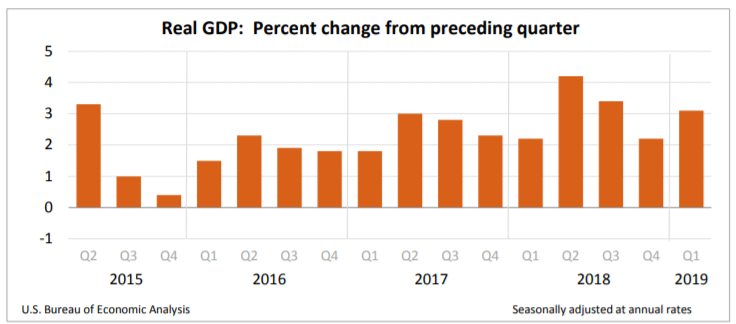
On May 30th the Commerce Department published its first revision of its advanced estimate of economic growth during the first quarter of 2019. The highlights are below, or the report can be accessed by going to the Bureau of Economic Analysis, Gross Domestic Product.
- The BEA lowered its advance estimate of the first quarter’s growth in the US economy's real gross domestic product from 3.2% to 3.1%. Even after the revision, growth was more than the fourth quarter of 2018.
- Real gross domestic income, another measure of economic growth, increased 1.4% in the first quarter, compared to an increase of 0.5% in the fourth quarter.
- The PCE price index (the Federal Reserve's preferred measurement of inflation) increased 0.4% in the first quarter. This was also revised downward from the advance estimate’s rate of 0.6%. The core PCE price index, which excludes food and energy, increased 1.0% in the first quarter.
- Corporate profits fell 2.8% in the first quarter. This follows a fourth quarter drop of 0.4%.
Personal Income and Outlays
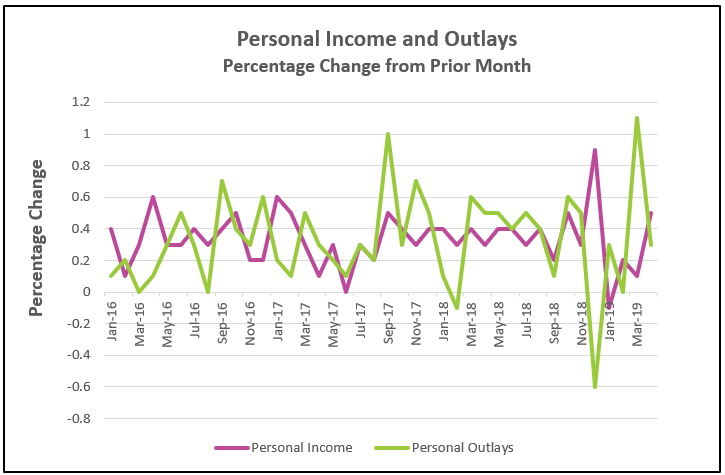
Consumer spending or personal consumption expenditures (PCE), accounts for approximately 66% of economic activity in the United States. (Read our lesson Gross Domestic Product – Measuring an Economy’s Performance to learn more about the importance of PCE.) Over an extended period, consumer spending is directly tied to household income. Watching the trends in these figures provides an important measure of the economy’s health. The Commerce Department released its report Personal Income and Outlays, April 2019 on May 31st. The highlights are listed below.
- Consumer spending increased 0.3% in April. This follows a sharp increase of 1.1% in March, which was the largest gain since August 2009. While April’s gain was substantially less than March’s gain, it was near the average (0.3%) over the prior 12 months.
- Personal income increased 0.5% in April, following a 0.1% increase in March.
- Real disposable income, or the income after inflation and taxes, increased 0.1% in April. This follows a decrease of 0.2% in March. A positive increase in real disposable income means workers are experiencing an improvement in their standard of living.
- The PCE price index has gained some momentum since the beginning of the year with every monthly increase exceeding the prior month, rising from a -0.1% in January to 0.3% in April. Over the prior 12 months, prices have gone up 1.5%. The more stable core price index has also increased. Since last month, the core price index increased from 0.1% to 0.2%, and 1.6% over the prior 12 months. Both indexes are significantly under the Federal Reserve’s target of 2.0%.
Consumer Price Index
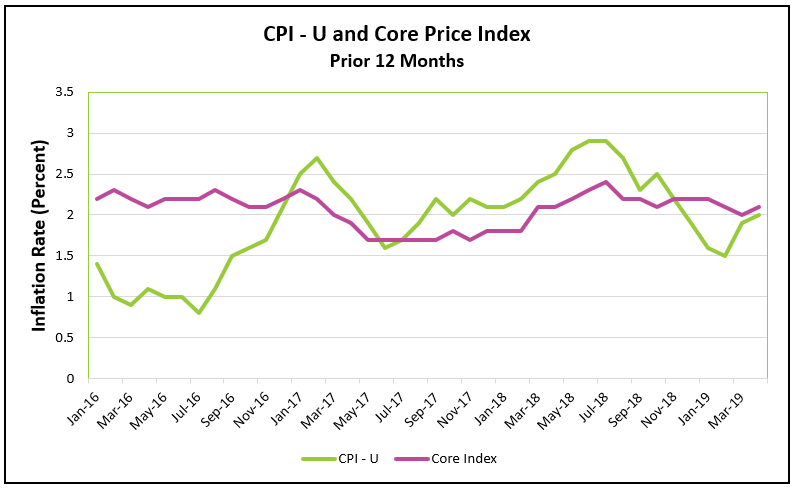
Inflation remains tame. The Bureau of Labor Statistics published Consumer Price Index – April 2019 on May 10th. The data are consistent with the PCE price index, which was discussed in the preceding paragraph. Here are the highlights of the BLS report.
- The most quoted consumer price index, CPI - U, increased 0.3% in April, down from the 0.4% increase in March. Inflation equaled 2.0% over the prior 12 months.
- For the third straight month, the monthly core index rose 0.1%. The index increased 2.1% over the prior 12 months.
- Energy prices continue to account for a large portion of the monthly changes. Over the prior year they have increased 1.7%, but prices have been very volatile. Energy prices declined 2.8% last November, and they rose 3.5% in March. Gasoline prices have fluctuated the most.
- April's food prices fell 0.1%, the first drop in 15 months. Food prices have increased 1.8% over the prior 12 months.
Employment
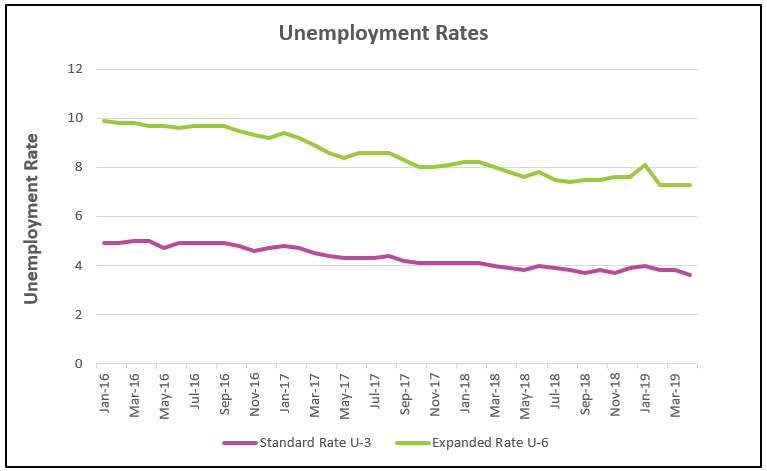
Unemployment dropped to 3.6%, its lowest level since 1969. Real wages continue to increase, fueled by labor shortages in many industries. Employers are having trouble finding qualified help and are accepting more workers with less than a high school education. Unemployment of this group fell from 5.9% to 5.4%. The highlights of the Bureau of Labor Statistics's report are below, or the report can be accessed by going to The Employment Situation – April 2019.
- The standard unemployment rate dropped from 3.8% in March to 3.6% in April. (Watch our video Types of Unemployment and try to identify what type of unemployment the actors are experiencing.)
- 263,000 workers were added to payrolls in April. Professional and business services, health care, and construction benefited the most.
- The average workweek increased 0.1 hours to 34.4 hours. Hourly wages for all workers increased an average of $0.6 to $27.77. Wages increased 3.2% over the prior 12 months.
- U-6, the broader measure of unemployment, remained at 7.3% for the third straight month.
National Debt
The Federal Reserve Bank of St. Louis recently updated its graph showing the relationship between GDP and total public debt. Government debt continues to outpace growth in the economy. Public debt was 105.3% of GDP at the end of 2018, up from 104.2% in the third quarter of 2018. This compares to 62.9% in the fourth quarter of 2007.
Much of the economy’s recent growth has been financed using expansionary fiscal policy. Lower tax rates in 2017 increased disposable income, which has positively influenced business and consumer spending. Government spending jumped 2.5% in the first quarter of 2019. This compares to an average increase of 0.33% between 2008 and 2016. The surge in fiscal spending and tax cuts have contributed to the growing budget deficit and national debt. What are the ramifications of having a debt that exceeds the GDP? The best measurement for a debt’s affordability, whether it is a family purchasing a new home, a business, or a country, is the relationship between debt and income. The US national debt is increasing at an unsustainable pace because it now exceeds its income. Steps must eventually be taken to lower this ratio by reducing spending, accelerating economic growth, or a combination of both.
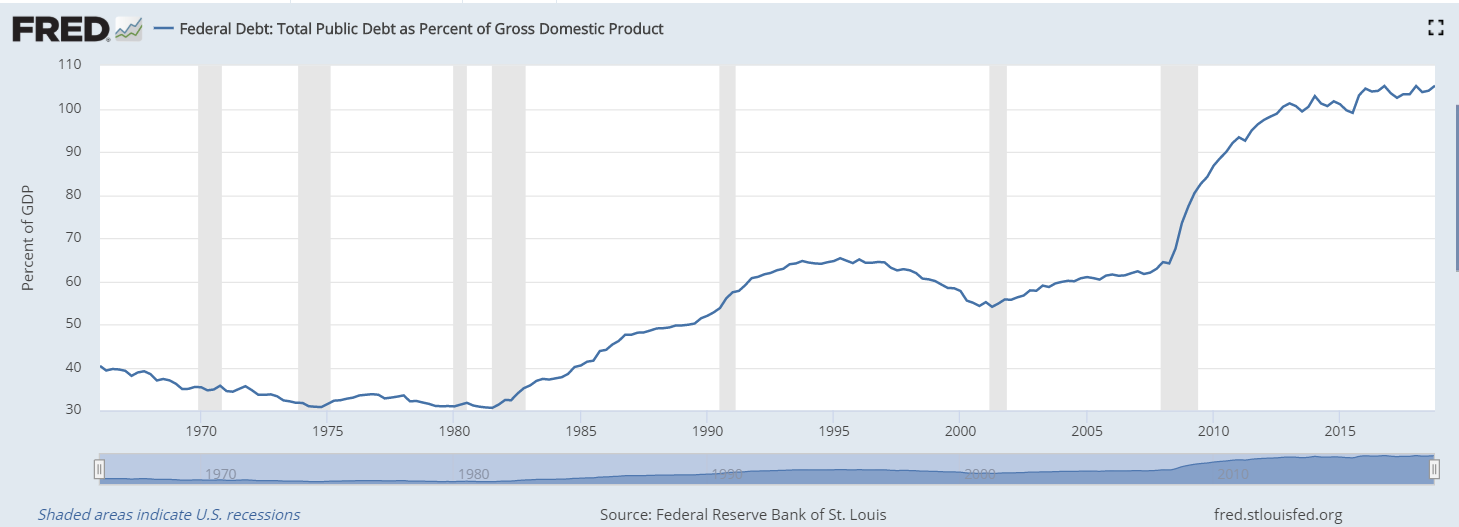
Source: FRED
Summary and Analysis
The Federal Reserve's
FOMC chose not to increase the
federal funds rate from its target of between 2.25% and 2.50% at their last meeting despite a reported 3.2% jump in real gross domestic product (since revised to 3.1%). Most economists believe 3.1% overstated the health of the economy. I expect growth in the second quarter to be less than in the first quarter for several reasons. There were abnormally favorable trends in inventories and exports that exaggerated the health of the economy in March. Inventories were the greatest since 2015. Large inventories can deter future growth if they are not combined with an increase in consumer spending because inventories increase when companies fail to sell as much as they expect. Yesterday the Federal Reserve Bank of Atlanta published its running forecast for GDP,
GDPNow, at 1.3%. Last quarter exports increased because many countries increased their purchase of US goods and built up their inventories in anticipation of escalating tariffs. I expect exports to weaken in the second quarter. The global economy remains weaker than the US economy, which further reduces the demand for US goods. Furthermore, a stronger dollar makes US goods more expensive relative to goods manufactured in other countries.
Consumer spending and manufacturing have decreased since the beginning of the second quarter. The
Census Bureau reported on May 15th that retail sales decreased 0.2% in April. Consumer spending accounts for nearly two-thirds of the economy. Industrial production was 0.5% lower in April and has slowed in three of the past four months according to a report by the
Federal Reserve. Concerns about a mounting trade war and tariffs, a weaker global economy, and a strong dollar have all contributed to the decrease. Weaker economies lessen the
aggregate demand. Tariffs imposed by other countries in retaliation to President Trump’s tariffs make US goods more expensive. These trends also contributed to the fall in corporate profits for two straight quarters.
Inflation has remained low, perhaps too low. Many economists, (myself included) believed the trade war would have impacted inflation more than it has. I still believe that if the trade war escalates prices would increase. Tariffs are paid by the importing company to the exporting country. A portion of the cost is passed through to the consumer. (Read our lesson
Supply and Demand - The Costs and Benefits of Restricting Supply to learn more about how tariffs affect consumers and suppliers.) So why haven’t the inflation figures been higher? First, the US is a service driven economy. Most services are provided domestically and are not subject to a tariff. Second, the dollar has been very strong. A stronger dollar lowers the price of imports and has offset some of the added costs of tariffs. Finally, it takes some time for the added cost to filter through the economy. However, the consumer will eventually pay more if the trade war continues to escalate as it has during the past two weeks. The
San Francisco Federal Reserve Bank estimates that tariffs will add 0.4% to the price level.
Employment remains healthy as more people are added to payrolls and real wages continue to increase. A shortage of workers suggests that the unemployment rate will remain low for the remainder of 2019. Wages should continue to increase as the labor markets get tighter. Employers will seek ways to improve productivity to deal with shortages of workers and higher wages. The
Bureau of Labor Statistics recently released a report concluding that productivity increased 3.6% in the first quarter of 2019. Higher real wages and a positive consumer sentiment should positively influence consumer spending and prolong the expansion.
The economy's vital signs are strong. Inflation and unemployment are near record lows. The economy continues to grow. I expect this expansion will become the longest recorded in July. But trade needs to improve if the expansion will continue into 2020.