State of The Economy - November 2018
The US economy wishes you Happy Holidays! Consumers are optimistic about the future – which should help the economy maintain its health into 2019. It is likely that the US economy will exceed President Trump's goal of 3% growth in 2018. Unemployment is 3.7%. Worker compensation has increased more than the inflation rate, which means that most families are more prosperous than at the beginning of 2018.
Real Gross Domestic Product (RGDP)
The
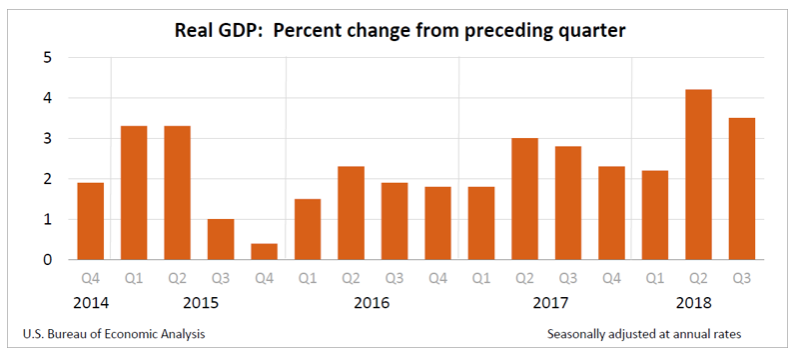
Bureau of Economic Analysis (BEA) released its “second estimate” for the third quarter on November 28th. The highlights include:
- Real gross domestic product (RGDP) grew 3.5%, down from 4.2% in the second quarter.
- Consumers led the charge with a 3.6% increase in consumer spending. (This was revised downward from 4.0%.)
- Inflation, as measured by the PCE price index slowed from 2.0% in the second quarter to 1.5% in the third quarter. Core prices also rose at a rate of 1.5%.
- Real gross domestic income, another measure of economic growth, increased 4.0% in the third quarter. The second quarter figure was revised downward from 1.6% to 0.9%.
- Federal government spending increased 3.5%
- Exports fell 4.4%.
Personal Income and Outlays
The BEA's
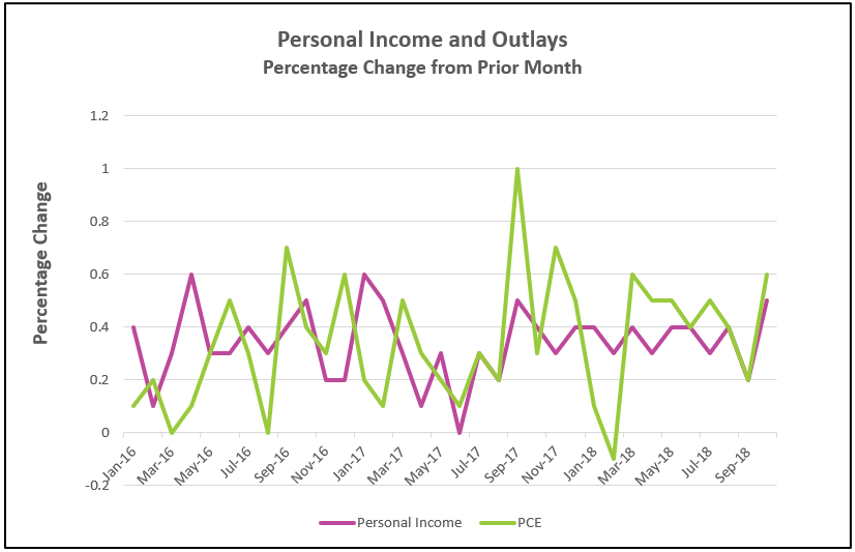
Personal Income and Outlays, October 2018 report provides encouraging news on the state of the economy in the fourth quarter.
- Personal consumption expenditures increased 0.2% in September and 0.6% in October. (The September figure was revised downward from 0.5% to 0.2%.)
- Personal income and disposable income both increased 0.5% in October. The increases are the largest since February 2017.
- People saved less in October. Savings as a percent of disposable income dropped from 6.7% to 6.3% between September and October.
- The core inflation rate remained within the Federal Reserve's acceptable range. The PCE price index increased 0.2%, while the core index, which excludes volatile food and energy, only increased 0.1% between September and October.
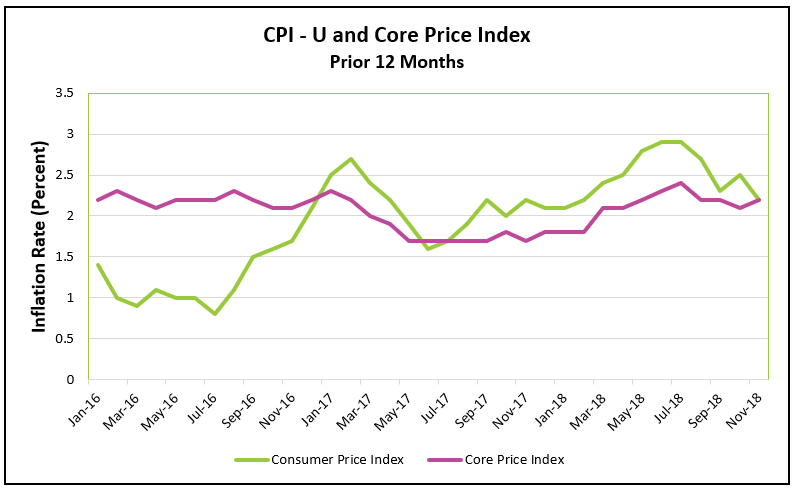
Consumer Price Index (CPI)
The Bureau of Labor Statistics (BLS) published its most recent
Consumer Price Index Summary on December 12th. Here are the highlights for prices in November.
- The CPI was unchanged during November. This follows October’s increase of 0.3%, the largest monthly increase since January 2018.
- The core index increased 0.2% in November.
- Both the CPI and core price index have increased 2.2% over the last 12 months.
- Lower gasoline and fuel oil prices contributed greatly to the large drop drop in the CPI between October and November. Gas prices fell 4.2% in November.
Employment
On December 7th the BLS published its October report,
The Employment Situation - November 2018.
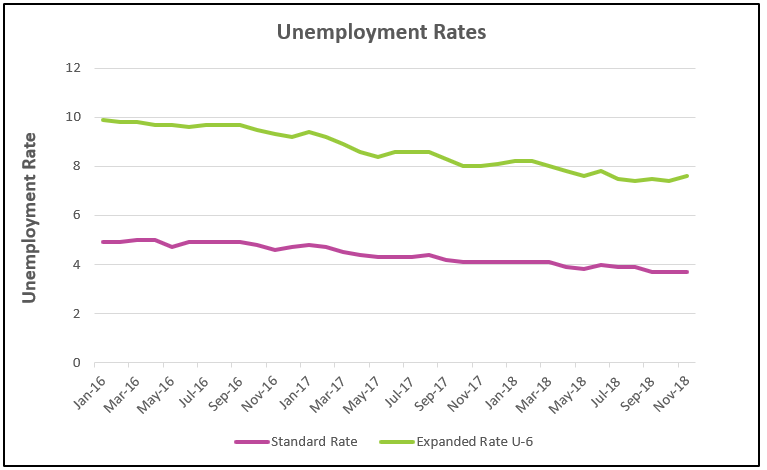
- November's standard unemployment remained at 3.7%, while the more inclusive U–6 rate increased 0.2% to 7.6% since last month.
- Unemployment has decreased 0.4% over the past 12 months.
- 155,000 workers were added to payrolls in November. This compares to an average gain of 209,000 over the past 12 months.
- The average workweek decreased 0.1 hour to 34.4 hours, while hourly earnings increased an average of $0.6 to $27.35.
- Over the past year, hourly earnings for all employees on private nonfarm payrolls has increased 3.1%, which is the largest gain in since 2009.
Summary and Analysis
Consumers feel good about the economy. They should. The Bureau of Labor Statistics reported that November’s unemployment remained at 3.7%, which is near a record low. 155,000 workers were added to payrolls, which brings the total to over 2 million people since the beginning of 2018. Included were many long-term unemployed. Not surprisingly, the growth in the demand for workers has pressured employers to increase wages to attract and retain workers. Real disposable income has continued to rise, helped by the tax cut earlier in the year. The Bureau of Economic Analysis (BEA) reported that personal and disposable income increased 0.5% in October, the largest increase since February 2017. It is not surprising that the University of Michigan's
Survey of Consumers reported that December’s measure of consumer confidence remained unchanged from its very favorable reading in November.
Consumers have more to spend, and they are spending it. Consumer spending, which makes up approximately 66% of economic activity increased 0.6% in October, the largest monthly increase since March. And, why shouldn’t consumers spend? It is the Holiday Season and the economy remains strong. (In a more recent press release, the Bureau of Labor Statistics reported that earnings fell slightly in November. Wages increased $0.07 to $22.95, but the average workweek was 0.1 hour less. The combination of an increase in wages and a drop in hours worked resulted in a slight drop in average weekly earnings from $941.51 in October to $940.84 in November.)
The Bureau of Labor Statistics reported that the consumer price index remained unchanged in November, largely due to a drop in gasoline prices. November’s core index rose 0.2%. For the past 12 months both the core index and the consumer price index have increased 2.2%. This exceeds the Federal Reserve’s target of 2%, but the Fed favors the PCE core price index. In its most recent report, the BEA reported the core index has increased 1.8% over the past 12 months, and the PCE price index was 2.0% higher than a year ago. (The PCE price index is normally a bit lower than the CPI indexes.)
I estimate the US economy will grow 3.22% in 2018. I share most economists’ views that during 2019 the economy will set a record for the longest recorded expansion, but the pace of growth will slow. How long will this expansion continue? After all, economies are cyclical, and a downturn is coming. While the US economy remains healthy, there are a few signs that we are nearing this recovery’s end.
Much of the economy’s growth has been financed using
expansionary fiscal policy. Lower tax rates have increased disposable income, which has positively influenced business and consumer spending. Federal government spending has jumped 3.5% over the past year. This compares to an average increase of 0.33% between 2008 and 2006. The surge in fiscal spending and tax cuts have contributed to the growing budget deficit and national debt. The Federal Reserve of St. Louis reported that the national debt grew to over 104% of the GDP in the third quarter. What does this mean? The best measurement for a debt’s affordability, whether it is a family purchasing a new home, a business, or a country, is the relationship between debt and income. The US national debt is increasing at an unsustainable pace because it now exceeds its income. I expect political pressure to slow the growth in government spending which will contribute to slowing the pace of growth.
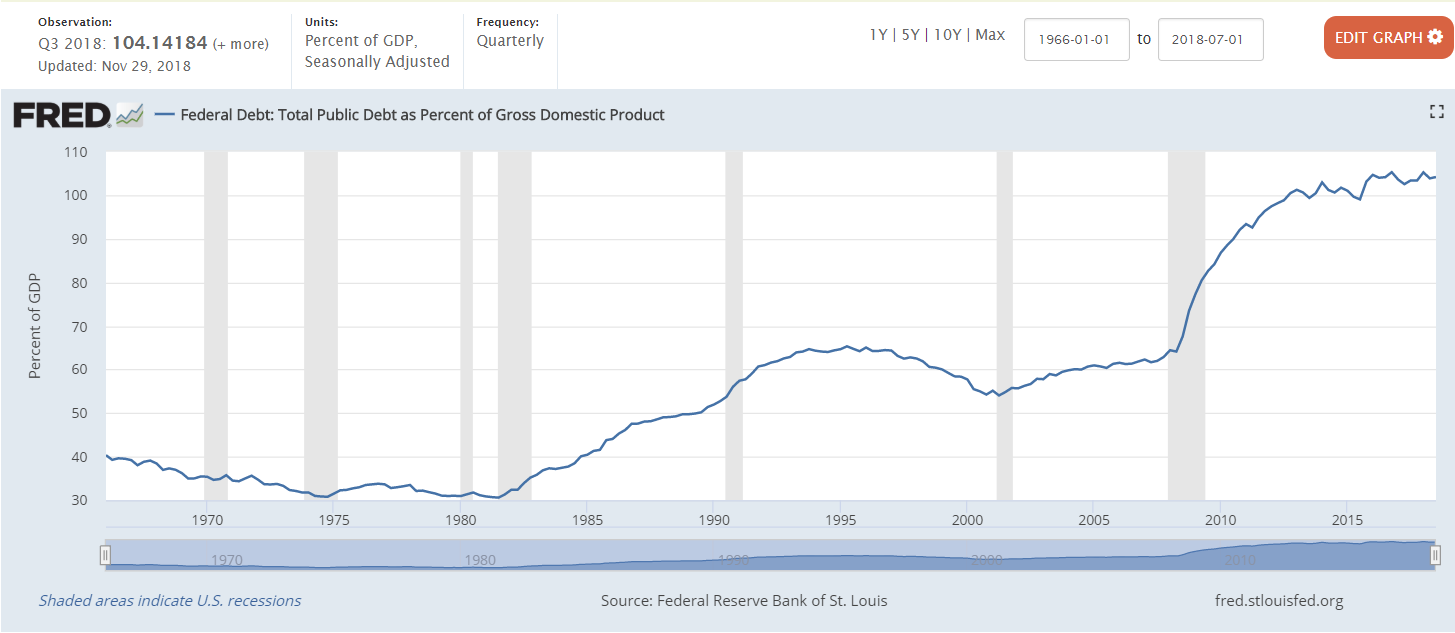 Source: FRED
The
Federal Open Market Committee (FOMC) increased the target
federal funds rate yesterday. President Trump will likely protest, saying that the increase will discourage economic growth. Higher interest rates do slow an economy’s pace of growth. Home-buyers may have to settle for a smaller home. The higher borrowing costs may discourage some businesses from proceeding with a project. So, why did the Fed increase rates? Slowing an economy reduces the threat of inflation. Inflation remains within the Federal Reserve’s target, but there are signs that it may be increasing. A growing
aggregate demand will add to
demand-pull inflation, especially as companies near their production capacity.
Real wages are rising, largely because employers must pay more to retain and attract labor. Companies will eventually increase their prices as costs continue to increase.
Tariffs will raise the price of imported goods since the importing company must pay a tax, and some of the expense will be passed through to consumers. (Read our lesson,
Supply and Demand – The Costs and Benefits of Restricting Supply for an academic discussion on the impact of tariffs.) This concern among investors and business people is reflected in the recent fall in stock prices.
What could limit the pressure on prices? Business investment in labor saving equipment could improve
productivity and relieve some strain on prices. Business investment increased 11.5% and 8.7% in the first and second quarters, but slowed to 2.5% in the third quarter. A strong US dollar has partially offset some of the inflationary pressure. Fewer American dollars are needed to buy an import, so imports are less expensive. However, a strong dollar hurts US exports because US goods and services become more expensive in the importing countries since their cost is higher relative to goods produced in countries with a weaker currency. Exports decreased 4.4% in the third quarter. Factors contributing to the growing
trade deficit include the stronger dollar, tariffs, and a stronger US economy relative to its trading partners. Several large countries including, China, Japan, and many EU countries are experiencing weaker economies.