The February reports are in. The economy continues to grow. Prices have increased more in January than any month since February 2013. The labor market is strong and showing signs of wage increases as conditions tighten. This points to a probable tightening by the Federal Reserve this afternoon. Please note we have tried to use the most updated information in our graphs, but these figures are constantly revised. Links to the sources have been provided so readers can secure the most up to date figures.
Gross Domestic Product
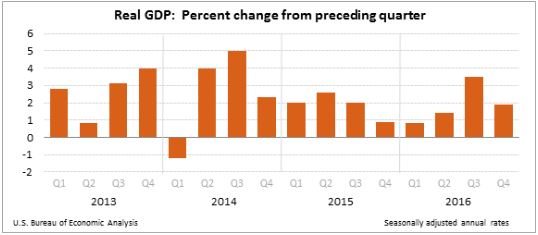
The US economy continues to grow and is well into its seventh year of expansion. The 2016 annual growth equaled 2.9%, down from the 3.7% rate in 2015, according to the February 28th Bureau of Economic Analysis report. During the fourth quarter of 2016, the GDP increased 3.9%. After adjusting for inflation the rate equaled 1.9%. The real gross domestic product (RGDP) increased 1.6% over the entire year. RGDP is the most common measure of economic activity because it adjusts the GDP for inflation, making it easier for economists to measure economic growth over many years. GDP is the market value of all the goods and services manufactured in the country. At the end of 2016, the United States' GDP equaled $18.86 trillion. (See our free lesson Business Cycles.)
The 1.9% increase in RGDP compares to 3.5% growth in the third quarter of 2016. The drop will probably not influence the Fed's decision to increase the federal funds rate because growth remains near the 2% average over the past year. Consumer spending was higher than expected, but investment spending was lower than expected. The drop in RGDP was also attributable to a widening trade deficit. Exports decreased and imports increased. The continuing weakness in many of the European and Asian economies has reduced the demand for exports. A drop in federal government spending also slowed the growth rate. Visit BEA GDP to read the full report. These figures will be revised in the coming months. The next revision is scheduled to be released on March 30, 2017.
To learn more about how the GDP and RGDP is calculated visit our free lesson GDP – Measuring an Economy's Performance.
Personal Income and Outlays
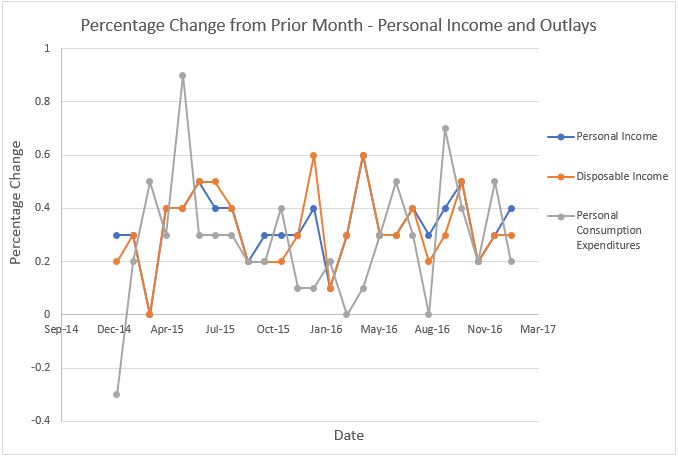
On March 1st, the Bureau of Economic Analysis reported that personal income increased $63 billion, or 0.4% in January. This compares to an increase of 0.3% in December. In 2016 personal income increased 3.6%, down from the 4.4% increase in 2015. Disposable personal income increased 0.3%, or $40.1 billion. Energy prices increased and were reflected in a decrease in the 0.2% decrease in disposable income when adjusted for inflation. Most economists expect wages to continue increasing as the competition for qualified workers grows. Consumer spending increased $24 billion. The savings rate equaled 5.5%, up slightly from the 5.4% rate in December. For a full report visit BEA Personal Income.
The graph below illustrates recent trends in personal and disposable income and consumption.
Inflation
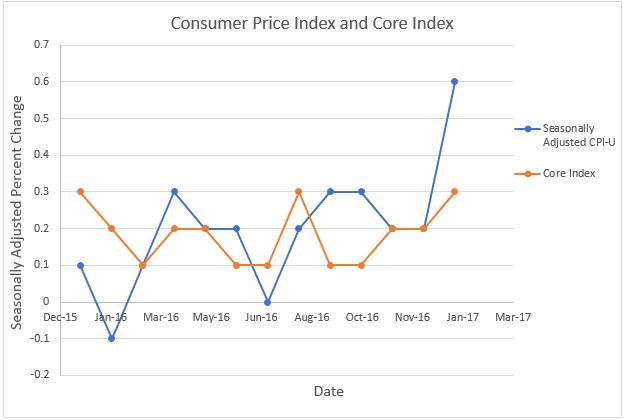
During December, the
consumer price index (CPI) increased a seasonally adjusted 0.6%, the largest monthly increase since February 2013. The 7.8% jump in gasoline prices had the greatest influence. For the past 12 months, the inflation index has increased 2.7%. These figures, and the graph below point to rising inflation. The annual inflation rate has not exceeded 2.0% since 2011. The
core price index, which excludes energy and food costs, increased 0.2% in February and 2.2% for the past twelve months. Economists view the core index as a more accurate measure of inflation since it negates the volatile price fluctuations in the energy and food markets. To read the full report released on February 15th visit
Bureau of Labor Statistics - Inflation. The graph below clearly shows an increasing trend in the CPI – U and the core rates. Inflation now exceeds the Fed's target of 2% which increases the likelihood that the Fed will announce an increase in the federal funds rate later today. To learn more about inflation we encourage you to visit our free lesson
Inflation.
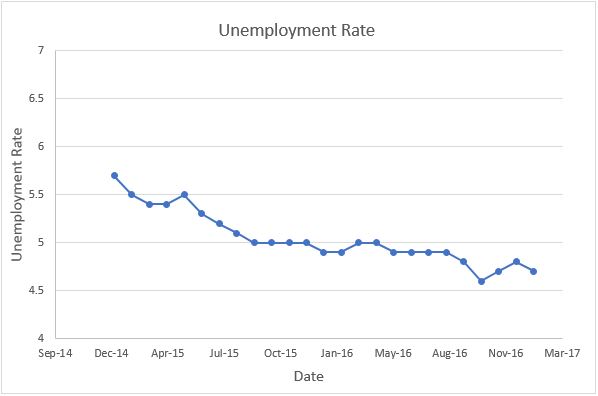
Employment
The employment picture continues to improve. Unemployment continues to decline and there is evidence of a tightening labor market which should lead to higher wages (and higher inflationary pressures). The unemployment rate dropped from 4.9% to 4.7%. Businesses are hiring. A total of 235,000 nonfarm jobs were added, up from 227,000 last month and 174,000 in December. The largest gain was in construction which added 58,000 jobs. This is a reflection of the anticipated increase in infrastructure spending. 7.5 million job seekers remain unemployed. The 63% participation rate was little changed from January.
On January 18th, the Federal Reserve
Beige Book noted "Labor markets were reported to be tight or tightening during the period. Employment growth ranged from slight to moderate and most Districts indicated that wages increased modestly." The Beige Book summarizes the economic data provided by the district banks that the
Federal Open Market Committee uses to set
monetary policy. During 2016, unemployment fluctuated between a high of 5.0% in March, to a low of 4.6% in November. These figures are close to what economists call the natural or
full employment rate. The market is beginning to see the increases in wages caused by the tightening of the labor market – which increases the probability of the Federal Reserve increasing rates in the near future. For the full report visit:
BLS – Employment Situation.