US Economy Grows and Stock Market at Historic Highs
The June economic reports are in. The US economy continues to grow, inflation remains low, and employment is rising. This news has helped push the stock market to historic highs. The
FOMC met on June 13 and 14th and, as expected, raised the
federal funds rate 0.25 percent to a target between 1.0 and 1.25 percent. In addition, the FOMC decided to begin reducing its balance sheet of assets accumulated following its
quantitative easing during the Great Recession. (Read the
Federal Reserve Press Release.)
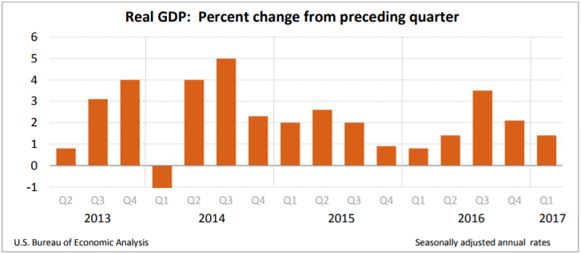
Real Gross Domestic Product
The Bureau of Economic Analysis revised its estimate of the first quarter
real gross domestic product (RGDP) upward from 1.2 to 1.4 percent.
Personal consumption expenditures (PCEs) and exports were slightly higher than the second estimate released last month, but remained lower than the last quarter of 2016. This is the second consecutive quarter that economic growth has slowed. Growth peaked in the third quarter of 2016 at 3.5 percent, and closed the year at 2.1 percent. The FOMC and many other economists predict the economy grew at a faster clip in the second quarter. The BEA will issue its initial estimate for the second quarter on July 28th. To read the full report visit
BEA.
Source:
BEA
The slow growth could also be partially explained because the seasonal adjustments do not provide an accurate picture of the first quarter. Note on the graph above that first quarter growth usually appears abnormally low in most years shown on the graph. Many economists believe the figures are not a true reflection of the first quarter's growth and call the difference "residual seasonality". The BEA describes residual seasonality as "when seasonal patterns remain in data even after they are adjusted for seasonal variations." The BEA is researching the issue.To learn more about how the GDP and RGDP is calculated visit our free lesson
Gross Domestic Product – Measuring an Economy's Performance.
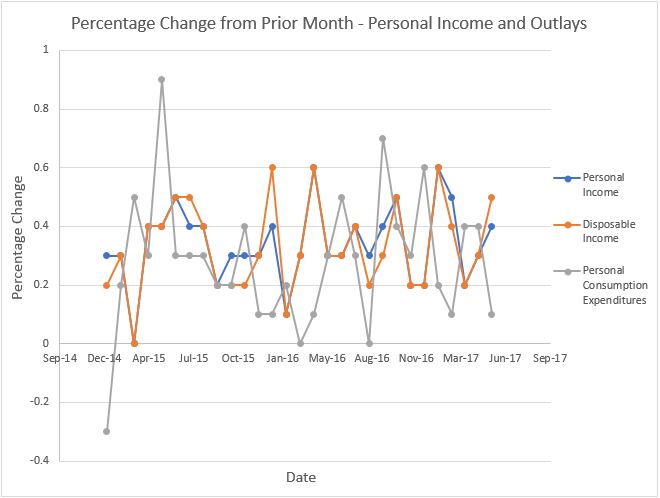
Personal Income and Outlays
Personal income and consumer spending both increased in May, according to the
BEA's Personal Income and Outlay's report released on June 30th. Personal income increased 0.4 percent, but most of the increase was in the proprietor's income and rental income categories. A 4.8 percent increase in dividend income helped propel disposable income higher. Wages and salaries only increased 0.1 percent, which adds credibility to the concern that wages are not increasing enough to help the middle class. In May, personal consumption increased only 0.1 percent. Personal consumption expenditures are a primary driver of the economy because they equal approximately 67 percent of the US gross domestic product. These expenditures include everything from car purchases to haircuts. May's spending is down sharply from the 0.4 percent increase in March and April. Services increased 0.3 percent, but that was offset by the 0.5 percent decrease in goods purchased. The 6.4 percent decrease in energy prices contributed greatly to May's spending decrease. Less spending resulted in more savings. The savings rate increased to 5.5 percent, the highest level in 2017.
Source:
BEA
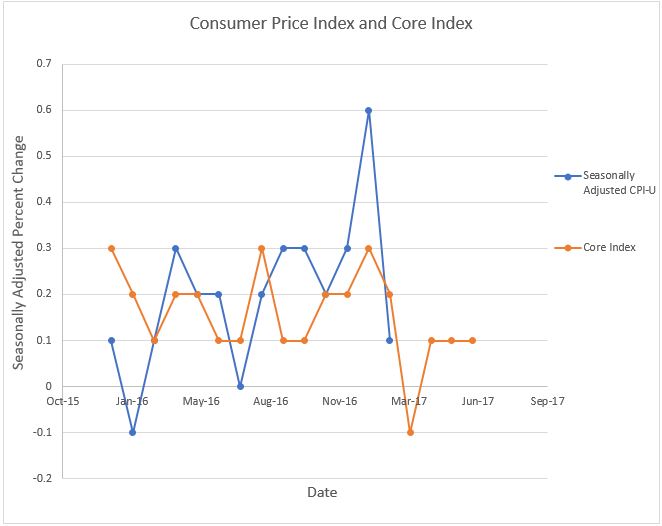
Inflation
Over the last 12 months prices have increased 1.6 percent according to the most recent CPI reported by the
Bureau of Labor Statistics on July 15th. Prices are unchanged for the month, and have been increasing moderately since the beginning of the year. The largest increase was in medical commodities (0.7 percent) and the largest drop was in fuel oil (3.7). Consumers have also benefited from a price war between wireless carriers. Prices dropped 0.8 percent in June. Most of the volatility in the CPI has been attributed to energy prices which have pushed the CPI to a high of 0.6 percent in January and a low of -0.3 percent in March. The volatility of energy and food prices is the main reason economists view the
core price index as a more reliable measure of inflation. The core index rose 0.1 percent in April and has increased 1.7 percent over the past 12 months. To learn more about inflation I encourage you to visit our free lessons
Inflation and
Causes of Inflation.
Source:
BLS
Employment
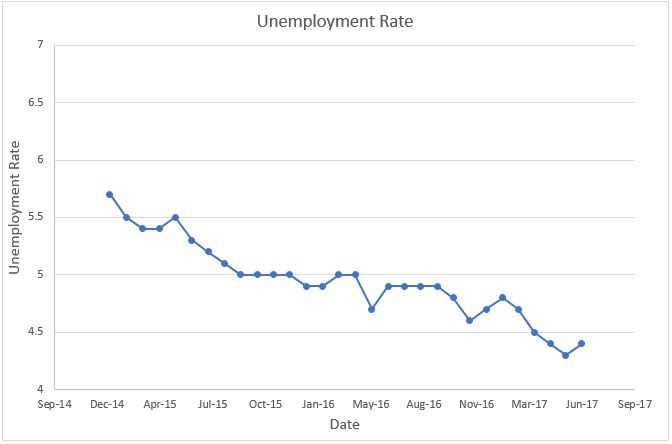
The
Bureau of Labor Statistics reported that the unemployment rate (4.4%) increased slightly in June, but the increase was positive news. More workers entered the labor market than expected. 222,000 workers were added to payrolls in June. The consensus had been 170,000. In May the unemployment rate was 4.3 percent. An individual must be actively seeking and unable to find work to be considered
unemployed. The participation rate also increased slightly because people who had been discouraged entered the labor pool. The participation rate inched up 0.1 percent to 62.8 percent. The participation rate is the percentage of the total population age 16 or older who are either employed or seeking employment. Approximately 16 million workers have entered the workforce since the Great Recession.
The industries that benefited the most are: health care, social assistance, financial activities, and mining. Since January employment has been relatively stable. The average work week gained 0.1 hours to 34.5 hours. The average hourly wage increased 4 cents, or 0.2 percent and is 2.5 higher for the year. The unemployment rate continues to be below what most economists consider the full employment rate of approximately 5 percent. Janet Yellen, the Chairperson of the Federal Reserve, and most economists predict that shortages of qualified workers should push wages higher.
Source:
BLS
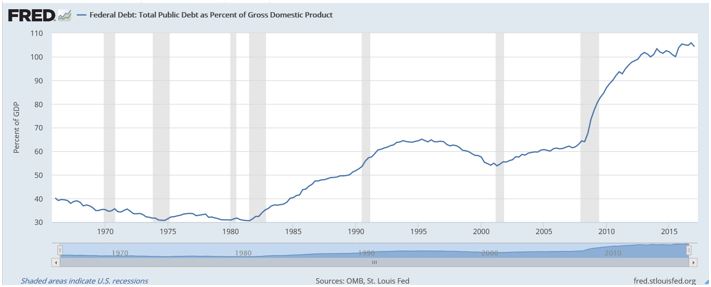
National Debt
During the first quarter of 2017 the Federal Reserve Bank reported that the national debt increased to $19.846 trillion. Can the US afford such a large debt? The best measurement for affordability is the relationship between debt and income. The US national debt now exceeds its income. The
St. Louis Federal Reserve reported that this ratio equaled 104.306 at the end of the first quarter of 2017. This is a drop from its peak of 105.87 at the end of 2016, but remains sharply higher than prior to the Great Recession, which began in 2008.
Source:
St. Louis Fed