Demand-pull inflation is inflation caused by an increase in an economy’s aggregate demand.
Demand-pull inflation refers to a short-term increase in an economy’s overall price level. While it is a macroeconomic concept, understanding it begins with a microeconomic perspective.
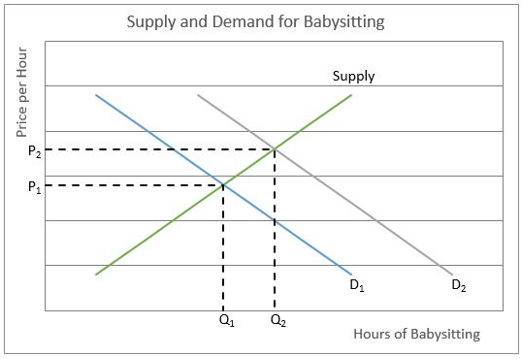
Imagine you run a babysitting business. As the economy recovers from a recession, more people seek your services. The rising demand exceeds your capacity to provide services, prompting you to increase your price and extend your working hours. This scenario illustrates an increase in the demand for your services, as shown in Graph 1.
Graph 1
You are not alone—most businesses experience similar increases in demand and respond by raising their prices and boosting production. This phenomenon, known as demand-pull inflation, occurs when an economy’s aggregate demand—the total demand for final goods and services from consumers (domestic and foreign), the government, and businesses—exceeds the available aggregate supply at a given price level during a specific period. Inflation arises when aggregate demand grows faster than aggregate supply.
The aggregate demand curve may shift following changes in consumer spending, government expenditures, business investments, and net exports. Increases in these variables shift the aggregate demand curve to the right, leading to inflationary pressure. The extent of demand-pull inflation depends on the slope of the short-run aggregate supply curve (SRAS).
During a recession or early recovery, the economy typically operates in the flatter portion of the aggregate supply curve. In this phase, there is significant excess capacity—unemployed workers, idle plants, and a surplus of inputs like labor and natural resources. As a result, prices remain stable or may even decline. Businesses compete aggressively for limited demand, making them less likely to raise prices.
When aggregate demand increases under these conditions, companies can quickly ramp up production without substantial cost increases, as shown in Graph 2, where the initial equilibrium is at Point A. As aggregate demand increases from AD1 to AD2, the economy moves to a new equilibrium at Point B. Prices rise modestly from PL1 to PL2, while production increases from RGDP1 to RGDP2.

As the economy expands, factories invest in equipment and hire additional workers to meet the higher aggregate demand. Businesses raise wages to attract and retain the workers they need, which fuels another round of increased demand and rising prices.
Now, consider an economy nearing the peak of a business cycle. Factories are operating near capacity, and growing demand for inputs drives input prices higher, potentially leading to shortages. The economy approaches its natural level of production, where all resources are used efficiently. The short-run aggregate supply curve (SRAS) becomes very steep at this point. Further increases in aggregate demand become highly inflationary, with minimal effects on production levels.
In Graph 3, the aggregate demand curves (AD) and SRAS are the same as in Graph 2, and the increase in AD is identical. However, the price level increase from PL1 to PL2 is much larger in Graph 3, while the output increase from RGDP1 to RGDP2 is less. This difference occurs because the economy is operating on the steeper part of the SRAS curve. The key takeaway is that an increase in aggregate demand near the peak of a business cycle is far more inflationary than during the early stages of recovery from a recession.
Real Gross Domestic Product (RGDP) increases in both Graphs 2 and 3, which is why economists generally view demand-pull inflation positively. It tends to occur during expansionary periods, accompanied by rising production. This contrasts with cost-push inflation, which arises from a supply shock that increases production costs for most goods and services. In such cases, producers cut back output, leading to stagnant or contracting economic activity.
For example, during the Great Depression, a significant drop in aggregate demand caused prices to decline—a phenomenon known as demand-pull deflation. Before the Depression, the Roaring 20s brought economic prosperity, but excessive borrowing and speculation created a financial bubble that eventually burst. Banks failed, and consumers panicked, drastically reducing spending. The decline in aggregate demand led to lower demand for goods and services, prompting businesses to cut their workforce and investment spending. AD entered a downward spiral, causing both RGDP and the price level to drop further.
Causes of Inflation
Gross Domestic Product – Measuring an Economy's Performance
Fiscal Policy – Managing an Economy by Taxing and Spending