Laffer Curve
View FREE Lessons!
Definition of the Laffer Curve:
The
Laffer curve is a graph developed by economist Arthur Laffer illustrating the relationship between the marginal tax rate and total tax revenues.
Detailed Explanation:
Economist Arthur Laffer believed that there is a point when an increase in the tax rate deters individuals from working. In 1980 he argued that point had been reached and a reduction in the tax rate would generate an increase in tax revenues for the US government. A graph illustrating this is the Laffer Curve.
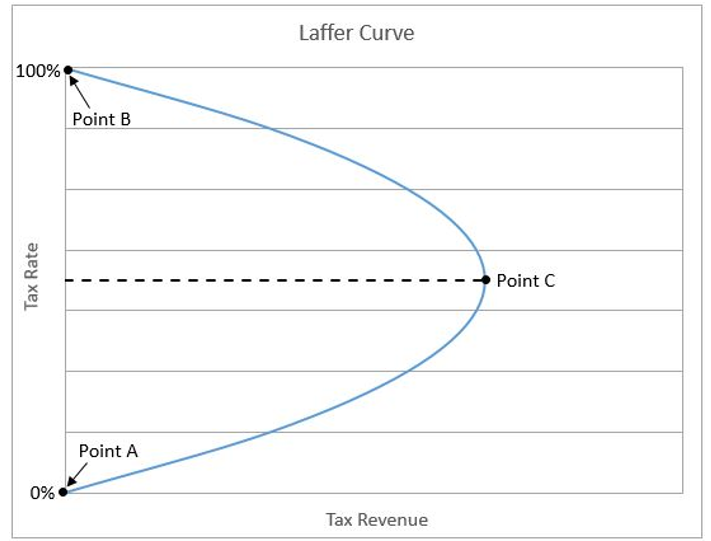
If the tax rate is zero, many people would work additional hours, but the additional tax revenue would equal zero. This is Point A on the Laffer Curve. At the other extreme, people would not have an incentive to work additional hours when the marginal tax rate (the marginal tax rate is the tax rate on the next dollar earned) equals 100 percent because at that point the government would take everything earned. This is Point B on the Laffer Curve. Laffer reasons that people are less willing to work when their marginal tax rate increases. An increase in the tax rate generates an increase in tax revenues at lower rates, but eventually, taxpayers will respond by preferring leisure to work. The number of hours worked would decrease, and a point is reached when tax revenues would actually fall following an increase in the marginal tax rate. That is Point C on the graph above.
For example, President Reagan told the story of how he and other actors would only act in two movies a year. His income for the third movie would have been taxed at 95 percent, so he and the other actors favored leisure to working on a third movie. At what tax rate would most people choose leisure over working more? Assume you earn $300,000 per year. You are provided an opportunity to earn an additional $10,000 that would be taxed at 80 percent, which means you could only keep $2,000 of the additional $10,000. Would you prefer working or leisure? Now assume the marginal tax rate is 15 percent, and you could keep $8,500. Would you choose to work or leisure? At what tax rate would you choose leisure over work?
The Laffer Curve is bowed outward because at higher tax rates more people would choose leisure. Up to Point C, an increase in the marginal tax rate would result in higher tax revenues. In other words, while some people may choose to work less, enough people would continue to work so an increase in the tax rate would increase total tax revenues. However, if the government increased the tax rates above C, enough people would choose leisure over work that tax revenues would decrease following the increase in the tax rate. Most economists agree with Laffer’s theory but disagree on the tax rate where Point C is reached.
President Reagan built awareness of the Laffer Curve when he pushed tax rate decreases in his 1980 economic plan. Reagan believed that people worked less because of high tax rates. A reduction in the marginal tax rate would increase the supply of labor, thereby increasing the nation’s production capacity.
Dig Deeper With These Free Lessons:
Fiscal Policy – Managing An Economy By Taxing and Spending
Factors of Production – The Required Inputs of Every Business
Supply and Demand – Producers and Consumers Reach Agreement