A price index measures the change in the overall price level by comparing the cost of purchasing the same items in a given year to the cost in a selected base year. The Consumer Price Index and the Producer Price Index are two common price indexes.
Inflation affects all of us, whether it is the price we pay for a product, a change in our income, or both. The Bureau of Labor Statistics estimates that inflation directly impacts approximately 80 million people’s income. This figure includes individuals paid directly by the United States government, such as Social Security beneficiaries, military personnel, SNAP (food stamp) recipients, and civil service retirees and their families. Frequently, private company employees have contracts tied to inflation. In addition, inflation influences many government policies, so it is essential that inflation is measured accurately.
Calculating a price index or inflation rate is theoretically simple, but in reality, the task is daunting. Statisticians calculate a price index by comparing the prices of two periods. The rate of change in the price indexes or the average price is the inflation rate. However, which items and which prices are used to get a good sample? The government uses an “imaginary” market basket containing goods and services commonly purchased by the group impacted. Economists measure inflation by comparing the costs of the identical market baskets. The inflation rate is the percentage change in the total cost of the market baskets between two periods.
To illustrate how economists use the market basket to calculate a price index that measures inflation, we will use Our Economy. Assume that Our Economy’s market basket includes three items: ten potatoes, four shirts, and thirty gallons of gasoline. Our comparisons use 2019 as the base year. Table 1 summarizes our market basket’s assumed prices and total cost of goods between 2019 and 2021.
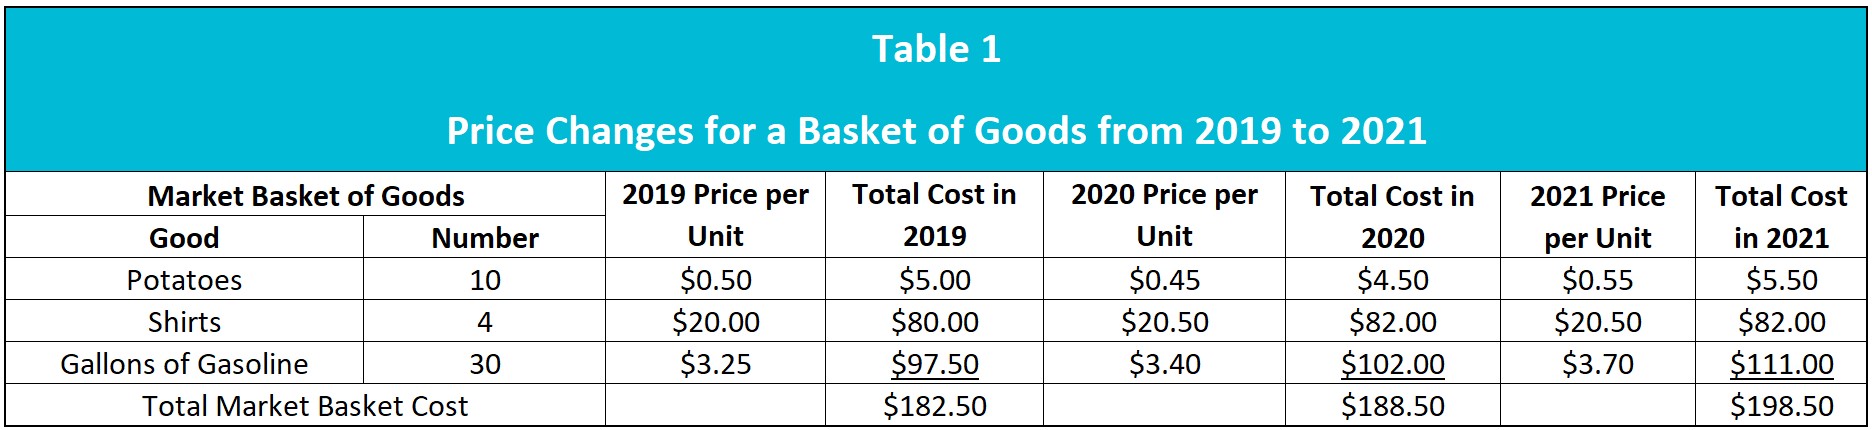
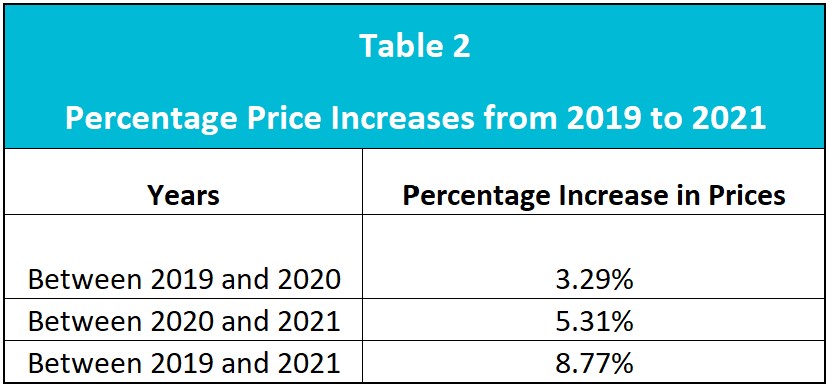
Notice that the cost of the same basket of goods increases annually even though the price of potatoes drops in 2020. This is because the basket’s cost is weighted by the number of items of each article included in the market basket. Our Economy is experiencing inflation because the price level is increasing. Table 2 provides the inflation rates between 2019 and 2021.
Inflation is measured in many ways using different market baskets. The market basket contents include items purchased by the specific group of interest. Because the market baskets differ, the indexes vary. Economists use the different indexes when evaluating how a particular group has been affected by inflation. The consumer price index uses a market basket of goods and services regularly purchased by an urban family. It is the most common measure of inflation because it is the broadest index and impacts the most people.
Indexes simplify comparing price levels between any two periods because only the index is needed to calculate an inflation rate. Every month, the Bureau of Labor Statistics releases the latest CPI. For example, if the CPI is 101 in year 2 and 129 in year 22, we know that prices have increased. We do not have to research the cost of the market basket. Using an index, like the CPI, enables a quick determination of the period’s inflation.
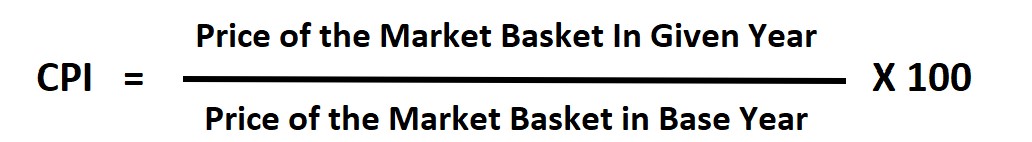
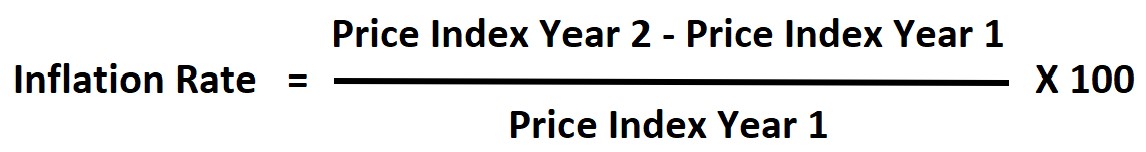
We can calculate the CPI after determining the cost of each year’s market basket. One year is chosen as the base year, to which all other market baskets are compared. The base year is usually given a value of 100. That way, by subtracting 100 from the new index, the percentage change in prices since the base year can be derived. The formula used to calculate the CPI is:
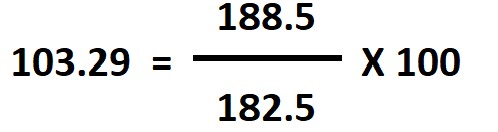
The CPI for 2020 in Our Economy is calculated below using 2019 as the base year.
The second column in Table 3 below provides the CPI between 2019 and 2021 in Our Economy, using 2019 as the base year. The third column calculates the inflation rate since 2019 by subtracting 100 (2019’s CPI) from the CPI of the later year (2021’s CPI). Prices have increased 8.77 percent since the base year of 2019. Note that the changes are identical to those in Table 2 above.
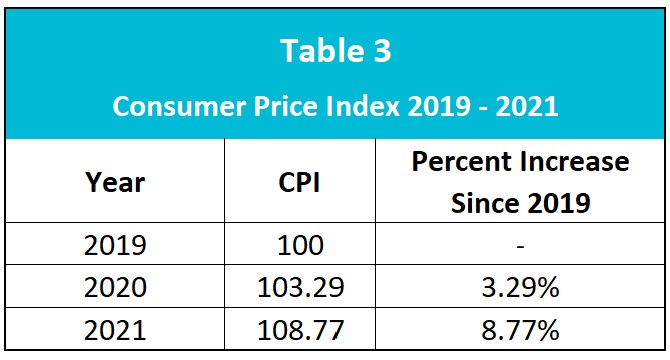
Economists use a price index to quickly calculate the inflation rate between two years without determining the cost of a market basket. For example, what is the inflation rate between 2020 and 2021? Use the formula below to find the answer of 5.31 percent. Note that the same answer was calculated using the market baskets shown in Table 3.
Analysts use other price indexes to measure how inflation impacts different groups. Some notable price indexes include:
Producer’s Price Index: The producer price index (PPI) measures the wholesale or seller market’s inflation.
Core Price Index: A core price index does not include food or energy. Many economists favor the core price index to monitor long-term trends because it excludes volatile food and energy prices.
Personal Consumption Expenditures Price Index (PCE Price Index): Unlike the CPI, the PCE index accounts for changes in spending behavior as the price of a good or service changes. The Federal Reserve favors this index.
Fiscal Policy – Managing an Economy By Taxing and Spending
Fractional Reserve Banking and The Creation of Money