Price Level
View FREE Lessons!
Definition of Price Level:
An economy’s
price level is the weighted average price of goods and services produced in an economy.
Detailed Explanation:
The economy’s price level is usually measured by the consumer price index. It provides the general level of prices and helps economists measure inflation or deflation. Inflation raises the price level, while deflation decreases the price level.
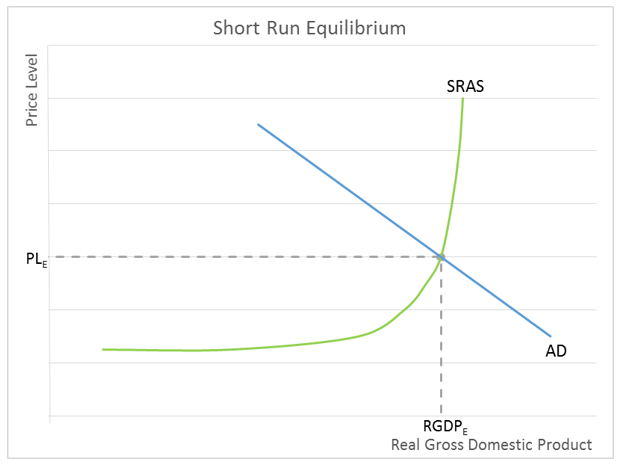
Economists use the aggregate supply and demand model to show anticipated movements in an economy’s price level. The aggregate supply is the total goods and services that producers are willing to supply (produce) at a given price level. The aggregate demand is the total goods and services that consumers are willing to purchase at a given price level. Like the microeconomic supply and demand model, the resulting price level and output (real gross domestic product) is determined by their intersection. On the graph below, the short-run equilibrium is met where the aggregate demand (AD) and short-run aggregate supply (SRAS) intersect. PL is the resulting price level and RGDP is the economy’s equilibrium real gross domestic product.
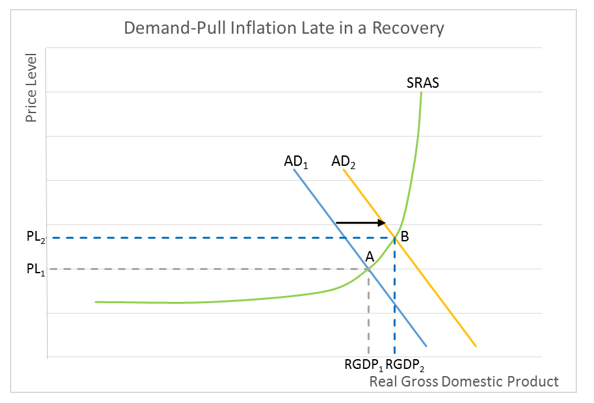
The objective of expansionary fiscal policy is to generate economic growth by increasing the economy's aggregate demand. Expansionary fiscal policy also increases the price level by causing demand-pull inflation as shown on the graph below, where the price level increases from PL1 to PL2 following an increase in the economy's aggregate demand from AD1 to AD2. Note that an increase in the aggregate demand also increases the economy’s output from RGDP1 to RGDP2. This is why economists favor demand-pull inflation over cost-push inflation.
Deflation, a reduction in the price level, would follow a drop in the economy’s aggregate demand – which occurs during a recession since the real gross domestic product would decrease.
Cost-push inflation increases the price level following a decrease in the economy’s short-run aggregate supply. Normally this is caused by a supply shock that reverberates throughout the economy. An increase in the price of a commonly used commodity can trigger a supply shock.
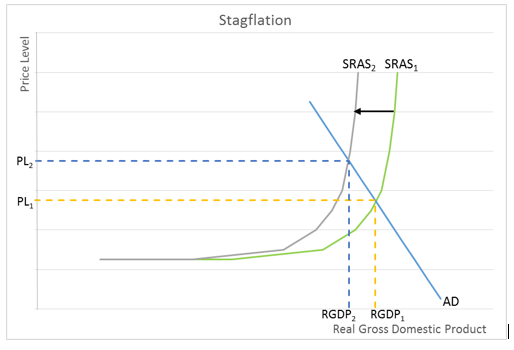
On a microeconomic scale, when a producer’s cost increases, it shifts the producer's supply curve to the left. The producer will pass some of the cost increase through to consumers by increasing the good or service’s price. Sales may be lost to competing companies. Now assume that every producer experiences an increase in its cost. In this macroeconomic case, it is easier to pass some of the cost through to consumers by increasing the price. This is what occurs in the economy when there is cost-push inflation. On the graph below we see a shift in the SRAS curve brought about by a supply shock. The new equilibrium is at the higher price level, PL
2. Note that there is a corresponding drop in the economy’s production. RGDP decreases to RGDP
2. The economy is experiencing stagflation, a dreaded period with the combination of escalating prices and a drop in the economy’s real gross domestic product.
A supply shock can be positive if there is a sudden decrease in the cost of a factor of production causing the SRAS to shift to the right. In these cases, the price level would fall and the real gross domestic product would increase. (It would be very unlikely that the price level would decrease. There would probably also be an increase in the aggregate demand during these prosperous periods resulting in a stable price level.)
The price level also increases when the money supply is increased and too much money is chasing too few goods and services. This is expressed in the equation M x V = P x Y, where M is the money supply, V is the velocity of money, P equals the price level, and Y is the output. Assuming V and Y are held constant, any increase in the money supply must increase the price level. In this case, more money is being used to buy a certain fixed number of goods. The price level would remain constant when the economy is growing and the money supply increase matches the increase in output.
Dig Deeper with These Free lessons:
Causes of Inflation
Inflation
Monetary Policy – The Power of an Interest Rate