The State of the Economy - January 2017
The Bureau of Economic Analysis and Bureau of Labor Statistics have published their January reports summarizing the performance of the US economy in 2016. 2016 was a fair year with real economic growth of only 1.9%. Prices increased 2.1% in 2016, but have been steadily increasing since mid-2016. One bright spot is higher employment. The unemployment rate is near what economists refer to as the
full employment rate. Competition for qualified workers will push wages higher and add inflationary pressure in 2017.
Gross Domestic Product
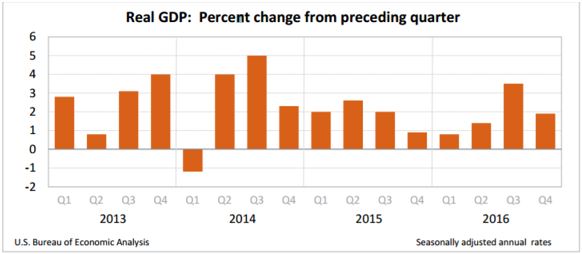
The BEA released its first gross domestic product (GDP) estimate for the fourth quarter of 2016. GDP is the market value of all the goods and services manufactured in the country. At the end of 2016, The United States' GDP equaled $18.86 trillion. During the fourth quarter of 2016, the GDP increased 4.0%, but the real gross domestic product (RGDP) only increased 1.9%. The real gross domestic product (
RGDP) is the most common measure of economic activity because it adjusts the GDP for inflation, making it easier for economists to measure economic growth over many years. The 1.9% increase in RGDP compares to a 3.5% growth in the third quarter of 2016. The drop in RGDP was largely attributable to a widening
trade deficit. Exports decreased and imports increased. The continuing weakness in many of the European and Asian economies has reduced the demand for exports. A drop in federal government spending also slowed the growth rate. However, growth in personal expenditures, private investment, and local and state government contributed to the increase in the RGDP. Visit
BEA GDP to read the full report. These figures will be revised in the coming months. The first revision is scheduled to be released on February 28, 2017.
To learn more about how the GDP and RGDP is calculated visit our free lesson
Gross Domestic Product – Measuring an Economy's Performance.
Source: US Bureau of Economic Analysis
Personal Income
In December, personal income increased $50.2 billion which is up 0.3% from November, as reported by the BEA on January 30th. This is higher than the 0.1% increase in November, but lower than the 0.5% increase in October. Consumers found they were better off because they had more money even after considering inflation. Real disposable income increased 0.1% in December. The greatest increase occurred in the private service sector and was reflected in wages and salaries. This follows a month when wages and salaries decreased, but is not as large an increase as in October. For the year, personal income increased 3.5%, down from the 4.4% increase in 2015.
Consumer spending increased $63.1 billion, an amount exceeding the increase in personal income. This means consumers must have invested less in savings, withdrawn money from savings or borrowed the money to finance the difference. This is seen in the small drop in the savings rate. In December, the personal savings rate was 5.4% of disposable income, down slightly from the 5.6% rate in November. For a full report visit
BEA Personal Income.
Inflation
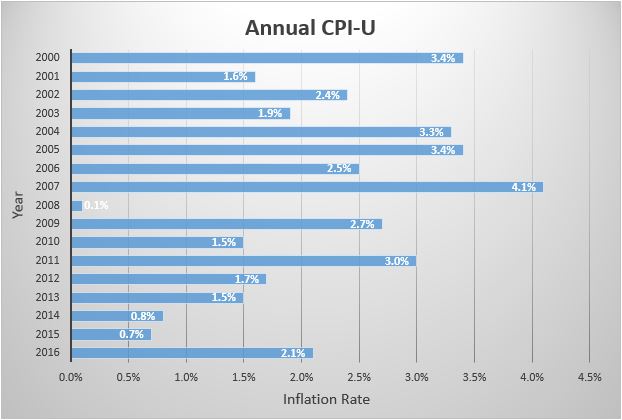
During December, the
consumer price index (CPI) increased a seasonally adjusted 0.3%. Inflation for 2016 totaled 2.1%. These figures point to a rising inflation rate. The annual inflation rate has not exceeded 2.0% since 2011. The largest increases in prices were in the energy sector which increased a combined 5.4%. Fuel oil alone rose 12.7%, but that was partly offset by electricity which increased only 0.7%. Medical services increased 3.9 percent. This is up from 2.9% in 2015. Food prices declined in December, and were flat for the year. This is particularly for those who dine at home, where there was a 0.2% decrease in December prices and a 2.0% fall in all of 2016. The
core price index, which excludes energy and food costs, increased 0.2% in December and 2.2% for 2016. Economists view the core index as a more accurate measure of inflation since it negates the volatile price fluctuations in the energy and food markets. To read the full report released on January 18th visit
Bureau of Labor Statistics - Inflation. To learn more about inflation we encourage you to visit our free lesson
Inflation.
Source: Bureau of Labor Statistics detailed reports
Employment
This morning, the Bureau of Labor Statistics released its Employment Situation Summary for January. There was little change. Businesses are hiring. A total of 227,000 non-farm jobs were added, up from 174,000 last month, but unemployment increased slightly from 4.7% to 4.8%. 7.6 million remain unemployed. There were improvements in retail, construction and financial services. The participation rate increased by 0.2% to 62.9%.
The unemployment among different racial groups was:
| Whites | 4.3% |
| Blacks | 7.7% |
| Asians | 3.7% |
| Hispanics | 5.9% |
The average workweek in the private sector was unchanged at 34.4 hours per week, and the average hourly wage equaled $26, up 3 cents from December. The annual increase has been 2.5%.
The long-term unemployment remains stubbornly high and showed no improvement in January. About 1.9 million people have not found work for the past six months. This is 24.4% of the total unemployed. Unfortunately, this figure has only decreased by 244,000 over the past year.
During 2016, unemployment fluctuated between a high of 5.0% in March, to a low of 4.6% in November. These figures are close to what economists call the natural or full employment rate. Further reductions in unemployment could trigger inflation. The full employment rate recognizes that some people are always seeking employment because they are moving or seeking another job.
For the full report visit: BLS – Employment Situation
National Debt
Earlier this week the Durst clock estimated that national debt climbed to $20 trillion. There are other lower estimates, but the important fact is our debt is climbing and is becoming more difficult to afford. The best measurement for affordability is the relationship between debt and income. The US national debt now exceeds its income. I have estimated that the national debt is now 105.5% of GDP. The St. Louis Federal Reserve reported that this ratio equaled 104.8% through the third quarter of 2016. I will be interested in their end of year figures.