An economy’s aggregate demand curve is a graph showing the total final goods and services (aggregate demand) demanded at different price levels.
A country’s aggregate demand is the total demand for all final goods and services produced within a country that consumers, businesses, government, and foreigners want to buy at a given price level. Like the demand for a good or service, aggregate demand and the price level are inversely related. The graph below is an aggregate demand curve.
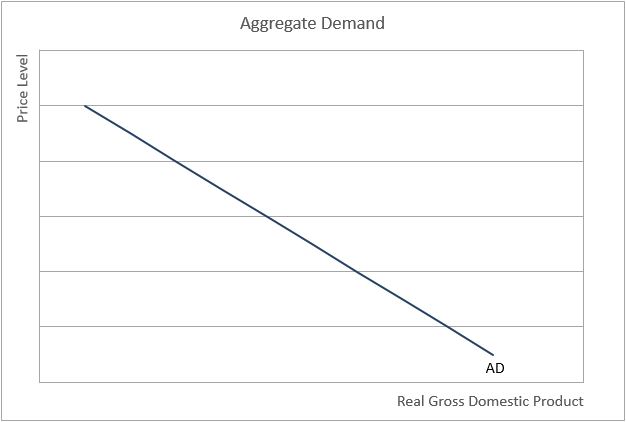
The economy’s price level, the weighted average price of the goods and services produced in an economy, appears on the vertical axis. It is measured by an index such as the personal consumption expenditures price index or consumer price index. RGDP, the economy’s total production when adjusted for inflation, is on the horizontal axis.
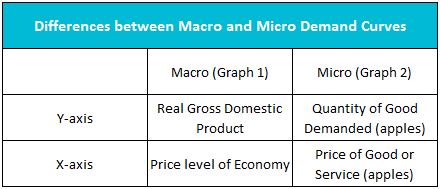
Intuitively students may think the aggregate demand curve has a negative slope because the demand curve for a single product studied in microeconomics has a negative slope. Students may also conclude that the aggregate demand curve is the sum of all demand curves. These conclusions are wrong. The microeconomic’s demand curve has a negative slope because consumers can substitute Good A with Good B if Good A’s price is too high. However, the price level on the aggregate demand graph is the general price level. Therefore, an increase in the price level assumes the prices of all goods and services and wages increase by the same percentage. The substitution effect is irrelevant.
The table below summarizes the differences between the demand curve for a good or service and the economy’s aggregate demand.
Movement Along The Aggregate Demand Curve
Three reasons explain the downward-sloping aggregate demand curve. A change in any of these cause movement along the aggregate demand curve rather than a shift of the aggregate demand curve.
Wealth Effect:
Most economists use the term wealth effect to describe how a change in the purchasing power of a consumer’s assets influences consumer spending when the economy’s price level changes. For example, if you have $10,000 in savings, and prices double, the money in savings would only purchase half of what it could before the price increase. The wealth effect affects consumer spending because a price level change influences the consumer’s purchasing power. An increase in the price level diminishes the consumer’s purchasing power and causes a decrease in the aggregate quantity demanded. Movement occurs along the aggregate demand curve to the higher price level.
Interest Effect:
The interest effect is the effect that a change in interest rates has on investments and RGDP following a price level change.
A drop in the price level can influence interest rates, which in turn impacts investment. If the price level drops, it is similar to an increase in income because consumers can use less money to purchase the same basket of goods they bought before the fall in the price level. The savings or additional income is either invested in a savings account or used to purchase more goods or services. The added savings increase the banking industry’s supply of loanable funds. Banks compete for loans by lowering their lending rates. In summary, the increase in the money supply to lend reduces the interest rate. The lower rate prompts some businesses to increase their investments to grow their businesses.
Net Exports Effect:
Net exports equals exports minus imports. A change in the price levels of two countries influences their trade, which impacts net exports. The extent depends on the relative change in both countries. An increase in the price level reduces a country’s aggregate quantity demanded. Suppose the price level in the United States increases more than in Japan. The US dollar would become more valuable relative to the Japanese yen. US-manufactured goods would become relatively more expensive than Japanese goods, resulting in a change in exports and imports.
US exports would decrease. Some Japanese buyers would seek substitute goods manufactured in Japan (or another country) rather than import them from the US. The demand for imports would increase. As the price level increases, imports become more attractive because foreign-made goods become relatively less expensive. US consumers would purchase more Japanese products if the US price level increased relative to Japan.
An increase in the price level reduces exports and increases imports, both of which reduce net exports and RGDP. The opposite is true. RGDP increases when the price level falls because exports would rise and imports would decrease.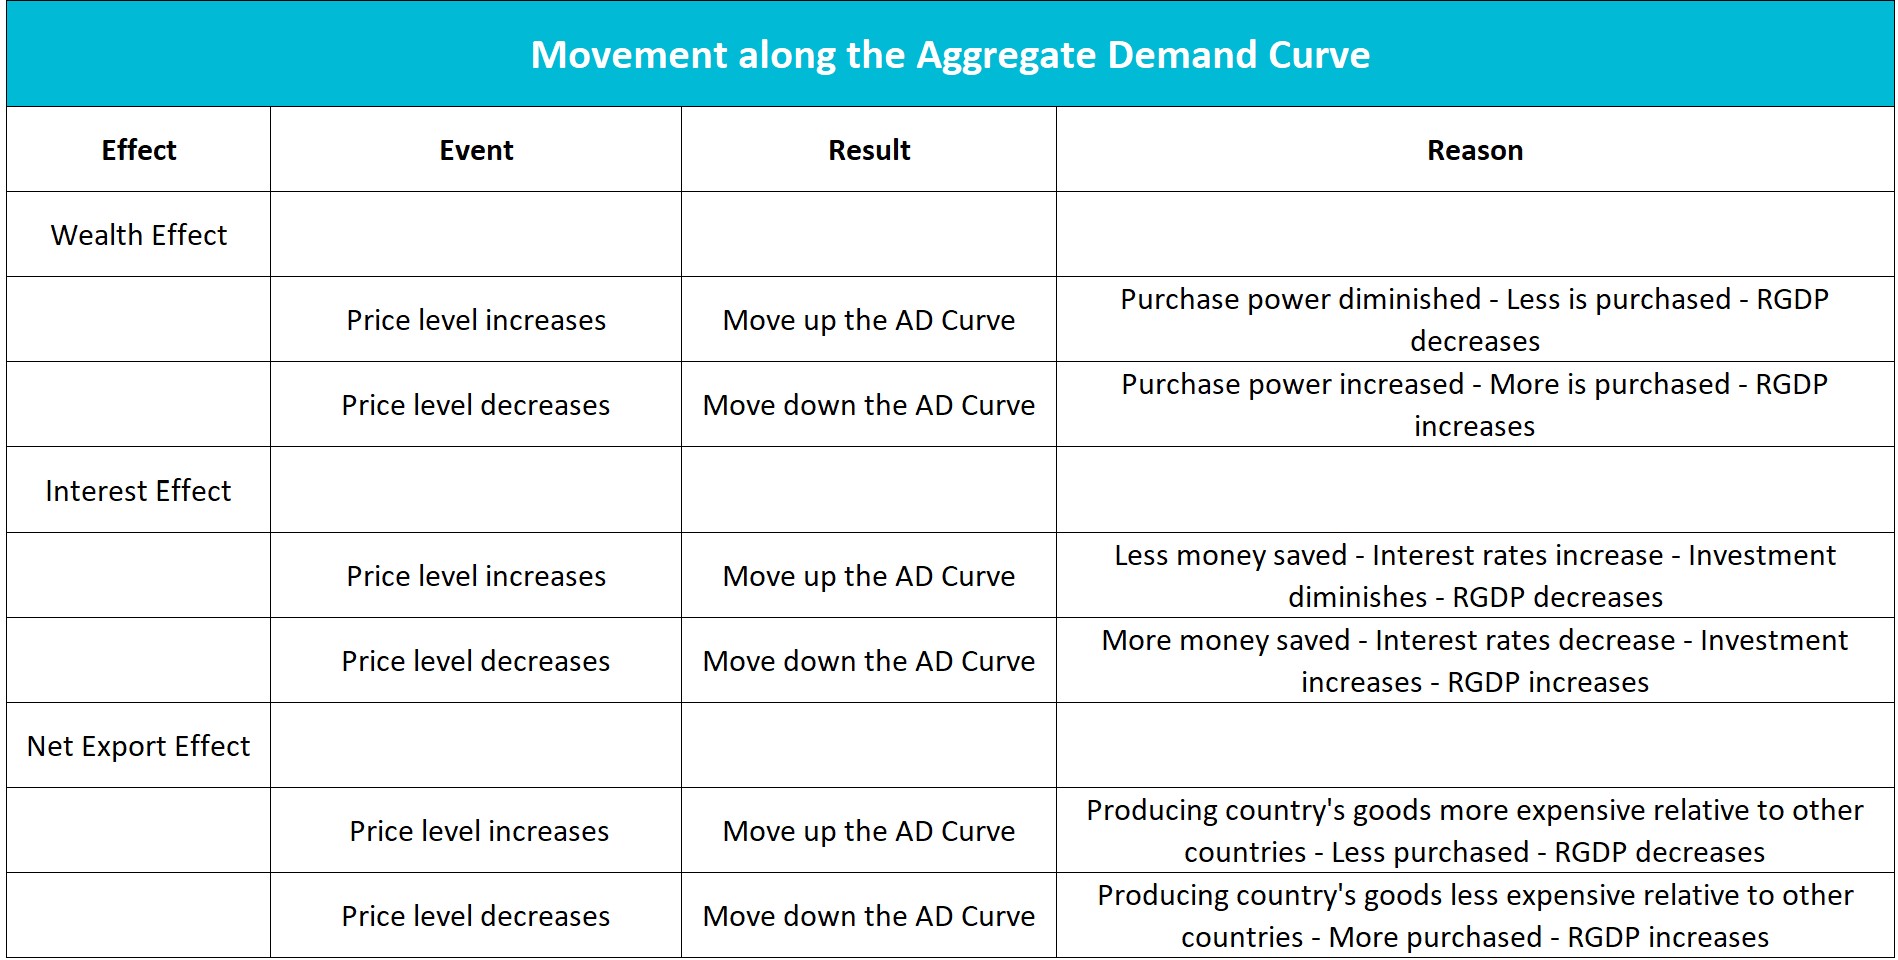
A Shift in the Aggregate Demand Curve
Frequently, events other than a price level change cause a shift in the economy’s aggregate demand. The expenditure equation for RGDP identifies the variables that cause a movement of the aggregate demand curve. RGDP equals the sum of personal consumption expenditures (C), private investment (I), government expenditures (G), and net exports (NX).
RGDP = C + I + G + NX
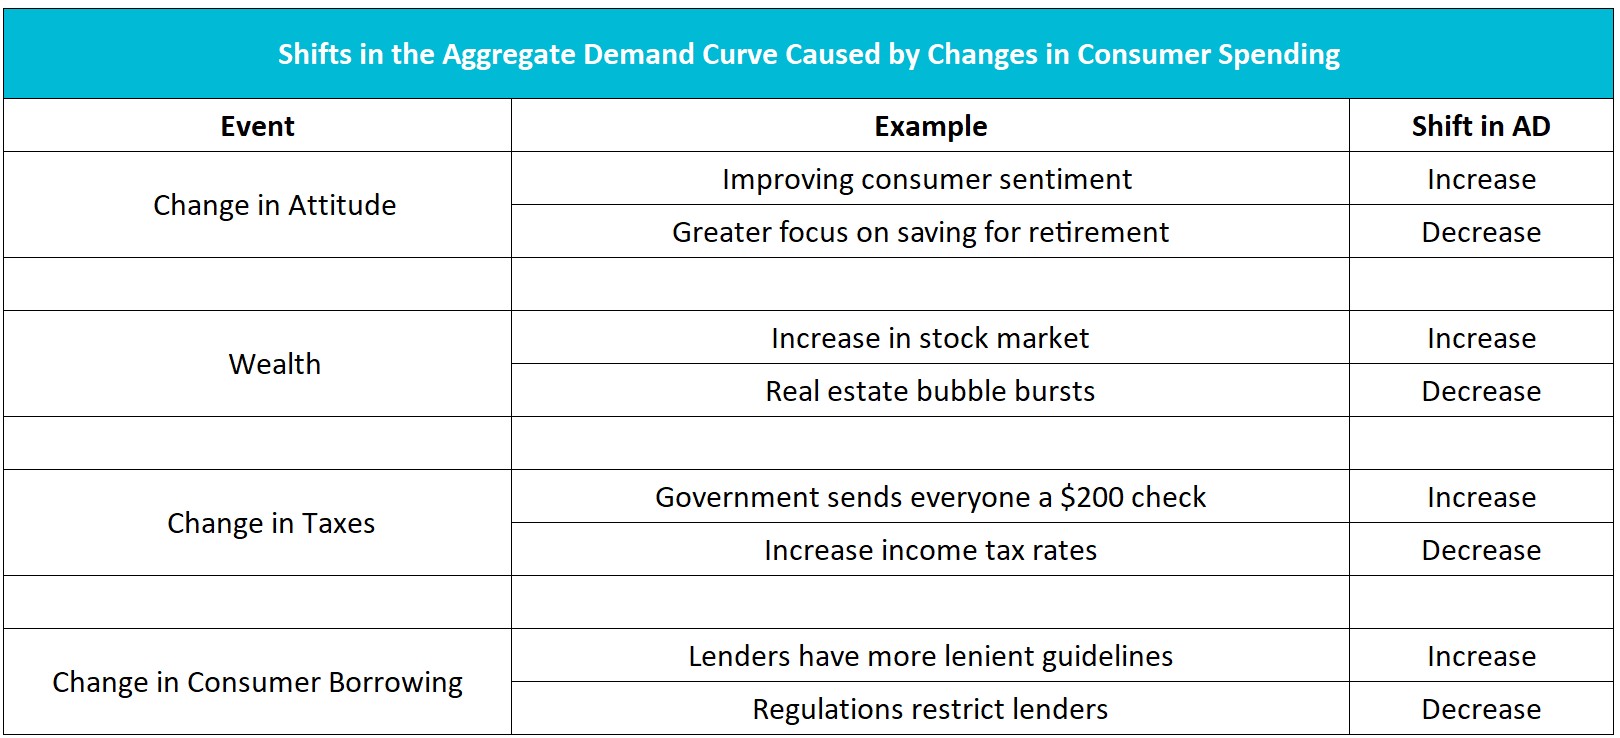
Change in Consumer Spending:
Anytime consumer sentiment changes, the aggregate demand curve shifts, all else being equal. Therefore, economists look closely at monthly statistics like consumer confidence. For the most recent consumer confidence report, use the link below:
https://www.conference-board.org/data/consumerconfidence.cfm
Optimistic consumers spend more. C increases in our RGDP equation when optimism rises and the aggregate demand curve shifts to the right. Consumers demand more goods and services at every price level. Conversely, when consumers are concerned about holding their jobs, they may hoard their cash and spend less. During these periods, consumer spending will decline at every price level, and the aggregate demand curve will shift to the left.
Changes in government policies related to taxation and spending influence taxpayers’ disposable income. Disposable income is the remaining income after paying taxes that households use to purchase consumable goods and services or save. Governments sometimes seek to increase consumer spending by cutting the personal income tax rate. Subsidies or transfer payments also increase disposable income. For example, Social Security, a transfer payment from the government to most senior citizens, increases the recipient’s disposable income and spending. Conversely, a consequence of raising taxes is a drop in disposable income and consumer spending.
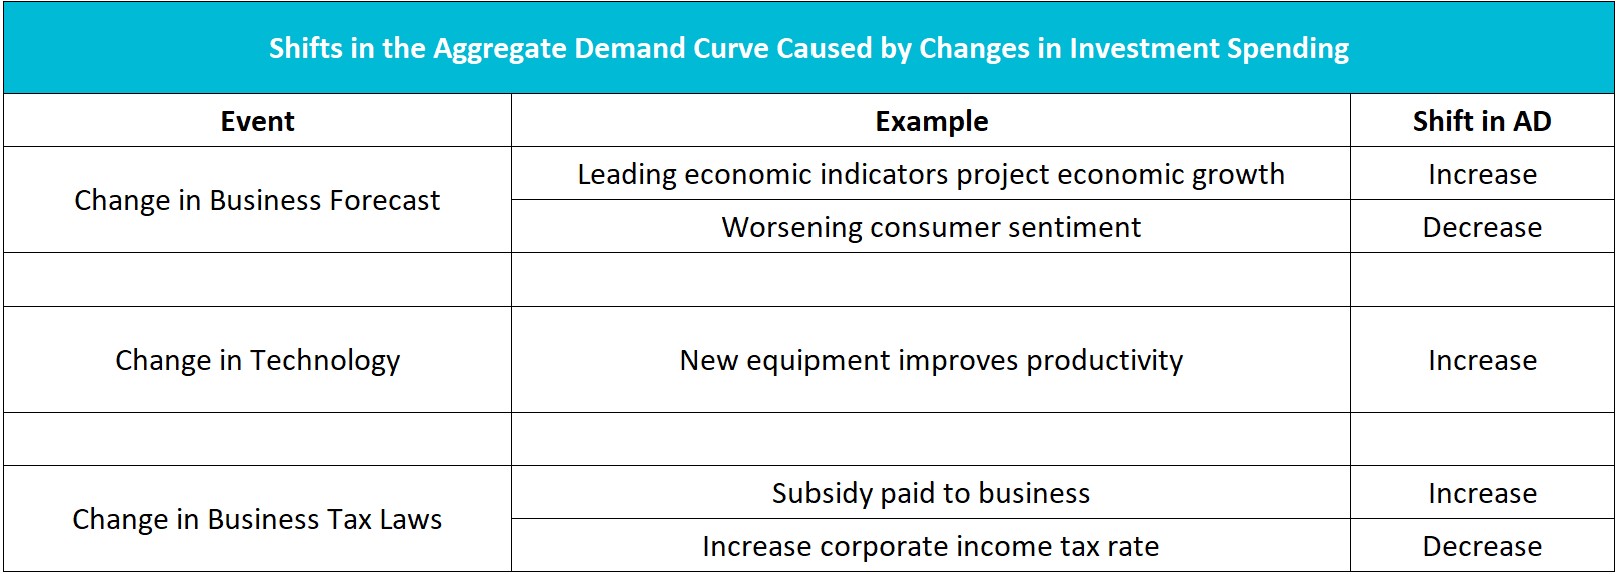
Change in Investment Spending:
Businesses are keenly aware when consumer confidence changes, and it affects a company’s sales forecast. When optimism improves, management may expand into new markets, build a new plant, or modernize equipment. Private investment increases, pushing up the economy’s aggregate demand curve.
Technological change may increase the demand for capital as companies modernize to cut costs and increase profits. The introduction of personal computers in the 1980s helped propel investment spending to record levels following the Economic Recovery Tax Act of 1981.
Government and Federal Reserve policies influence investment spending. Monetary policy aims to influence interest rates by controlling the money supply. Lower interest rates encourage companies to build plants and purchase equipment because of lower borrowing costs. Lower tax rates also spur businesses to invest more.
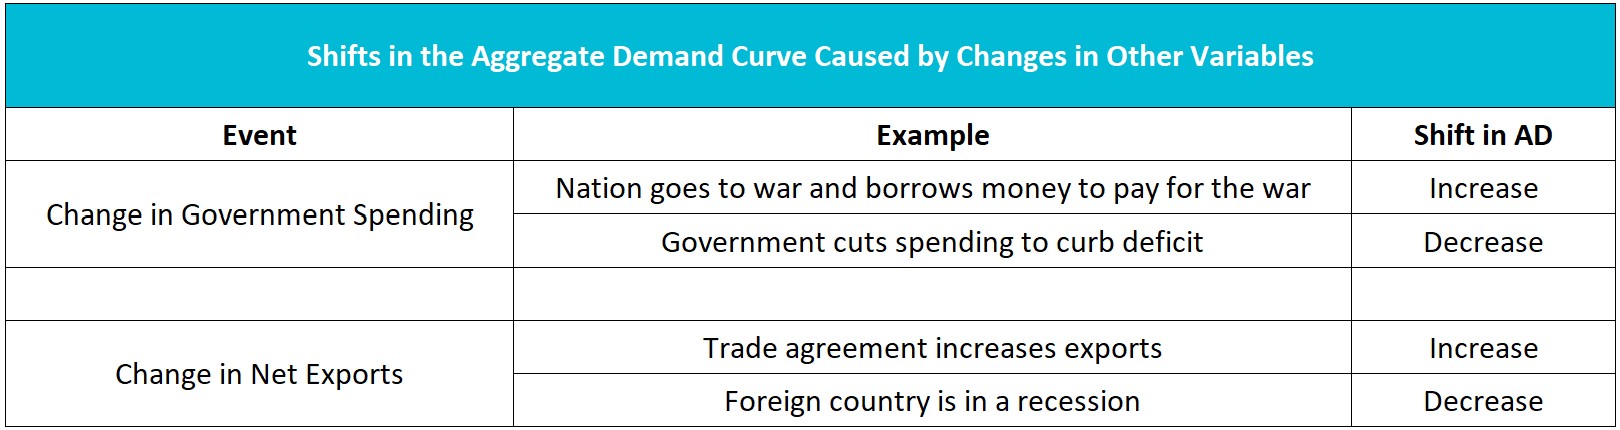
Change in Government Spending:
The government has an enormous demand for goods and services. US government expenditures and investment totaled 18 percent of GDP in 2021! Any change in government expenditures results in a change in the aggregate demand for the economy, assuming all other variables remain constant. An increase in government spending shifts the aggregate demand curve to the right. A decrease moves it to the left.
A Change in Net Exports:
The net export effect discussed above results from a change in the relative price level and would not cause a shift in the aggregate demand curve. However, a change in foreign buyers’ economic well-being or attitudes may cause a shift in the aggregate demand curve. When a country’s economy is devastated by a severe recession, US exports to that country will likely fall. Net exports are also affected by changes in exchange rates; the rate that one currency is exchanged for another.
The exchange rate between two countries influences trade between those countries. For example, a Tesla selling for $50,000 would cost €44,100 in Germany on the morning of February 23, 2022. If the exchange rate moves to where $1.00 is worth €0.9 (or €1 purchases $1.111), the same vehicle would cost €45,000. In this case, the dollar has appreciated or strengthened relative to the euro because one dollar purchases more euros.
Who benefits, and who is harmed by the appreciating dollar? The German buyer is hurt because imports from the United States cost more. Tesla’s exports to Germany would fall. However, American consumers would benefit because German cars would be less expensive in the United States.
An appreciating currency increases imports because they become less expensive than domestically produced substitutes. But an appreciating currency reduces exports because the exported good or service becomes more expensive than domestically produced substitutes.
The aggregate demand curve illustrates the inverse relationship between an economy’s price level and its production. The wealth, interest, and net export effects explain why a price change influences the aggregate quantity demanded. Changes in these cause a movement along the aggregate demand curve. Behavior patterns not affected by the price level can cause a shift in the aggregate demand curve. An improvement in consumer sentiment or an increase in disposable income are events that increase the aggregate demand at every price level. Economic hardship in one country and increased tax rates would decrease the aggregate demand at every price level.
Fiscal Policy – Managing an Economy by Taxing and Spending
Gross Domestic Product – Measuring an Economy's Performance
Monetary Policy – The Power of an Interest Rate
Causes of Inflation
Inflation