A business cycle is the upward and downward movements of economic activity over time.
Detailed Explanation:
Business cycles are unpredictable in that they vary in length and magnitude and are notoriously difficult to anticipate. Few economists expected the severity of the Great Recession (between the autumn of 2007 and spring of 2009), the biggest economic downturn in the US economy since the Great Depression in the early 1930s. Business cycles influence our ability to find and keep a job. Cycles also affect a company’s ability to earn a profit.
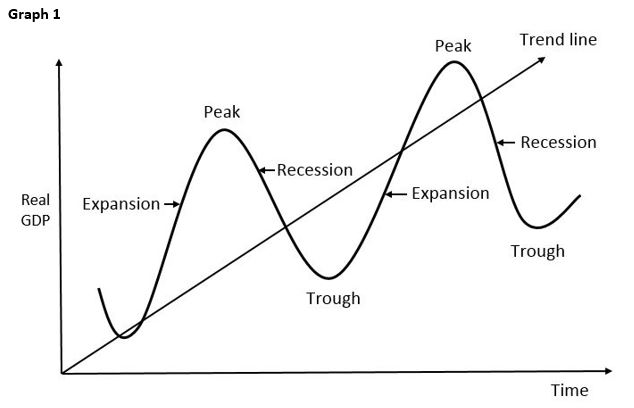
The trend line in Graph 1 shows the overall trend of increasing economic activity over time. Population growth and the development of capital generate economic growth. Occasionally, a decrease in overall business activity, or real gross domestic product, can result in an economic contraction, or recession. Slumping sales, increased unemployment, underemployment, increased business failures, and lower incomes are characteristic of recessions.
Depressions are the severest of recessions. The United States has only experienced one depression since 1900, the Great Depression in the 1930s. It began in August 1929. RGDP fell 27 percent by 1933. Nearly 25 percent of American workers lost their jobs. The lowest point in a business cycle, or trough, was reached in 1933. After 1933, production slowly began to increase, but it was not until 1936 that production finally reached the pre-Depression level. Companies were reluctant to hire, so unemployment remained very high. It was not until World War II that employment rates fully rebounded.
A recession or depression eventually ends when the economy begins to grow again. A growth period is an expansion, and the RGDP increases. During an expansion, businesses hire more people and invest in capital. Their sales and profits increase. The turning points in the business cycle are the troughs, where a recession ends and an expansion begins, and the peaks, where an expansion ends and a recession begins.
Characteristics of a Business Cycle
Varying Length: Business cycles vary in length. The economy grew over 600 percent between 1945 and 2013. There were 11 business cycles in the US during this period, according to the National Bureau of Economic Research, the agency that determines whether the US economy has entered a recession. Follow the link below to the National Bureau of Economic Research website to view all of the US cycles since 1857.
The 11 US cycles between 1945 and 2013 averaged five and a half years, but the time between troughs varied. The cycle between March 1991 and March 2001 lasted ten years! During this expansion, the US economy grew approximately 41 percent. A shorter expansion occurred between the third quarter of 1980 and the third quarter of 1981. Fortunately, the US economy has experienced tremendous stability and consistent growth over the long run. The dips in RGDP (recessions) are modest compared to the growth in RGDP (expansions). The average recession has lasted just under a year since 1945. Few countries have been as fortunate. For example, the CIA World Factbook reveals that in the US, the GDP growth rate has ranged from 1.6 to 2.8 percent between 2011 and 2013. Argentina’s range has been from 1.9 to 8.9 percent during the same period. Libya has had an incredible range of 166 percent. It had a drop of 62 percent in 2011 and an increase of 104 percent in 2012! Visit the link below to the CIA World Factbook to learn more about the GDP of other countries. Search for a country, and then select “Economy” to see a description of the economy and how stable it is overall. Which countries are most stable? Which have suffered persistent economic turmoil?
Varying Peaks and Troughs The positive trend line illustrates the continued strength of the US economy. Each succeeding peak and trough of the business cycle is higher than the prior one. Business cycles also vary in amplitude. In other words, the magnitude of expansions and recessions fluctuates over time. For example, during the ten-year expansion between 1991 and 2001, the economy grew 2.7 percent in 1993 but 4.1 percent in 2000. Recessions have a negative growth rate because the economy is contracting. The worst recession since 1945 was the Great Recession, where the economy contracted three percent in 2009. This is 50 percent more than the two percent decline in 1982. Recessions always bring hardship, but the magnitude of hardship differs dramatically. Of course, the recession in 1982 was more severe than the recession in 2008 for those who lost their jobs in 1982 and retained their jobs in 2008!
Businesses, investors, economists, and governments know that all expansions must end, but they do not know when a contraction in the economy will begin. Companies would love to know when a recession would start or end before expanding a manufacturing facility or hiring additional workers. Investors would likely sell the stock of a company if they knew a recession was going to reduce that company’s profits in the near future.
Economists and businesspersons use leading economic indicators to forecast the future. Leading economic indicators are measurable variables that normally change before the rest of the economy. Variables like the average work week for manufacturers, the number of first-time applicants for unemployment insurance (unemployment insurance is paid to workers who have been laid off), new building permits, and new orders for capital goods are all leading economic indicators because they tend to change before a trough or peak. Businesses anticipating a recession may begin to lay off workers, so the number of applicants for unemployment insurance increases. Some companies may build new manufacturing facilities if they expect a future expansion, which would increase building permits. The video below explains business cycles.