A change In demand results in a shift in the entire demand curve as opposed to a change in the quantity demanded where there is movement along the demand curve.
Detailed Explanation:
Any factor influencing the quantity demanded of a good or service, excluding its price, triggers a change in the overall demand for the product. Numerous variables play a role in shaping the demand for a good or service, and alterations in the price of one product can have ripple effects on related products. For instance, if a local gas station lowers its prices, other stations may need to match or suffer a decline in demand, given that they offer substitute products. Similarly, a decrease in cigarette prices could boost the demand for medical services due to the potential health impacts on smokers, establishing cigarettes and medical services as complements.
Consumer income is another significant determinant affecting the demand for various goods. An increase in income amplifies the demand for normal goods, such as new vehicles, while reducing the demand for inferior goods, like used vehicles. Advertising plays a pivotal role as companies invest substantial resources to cultivate customer loyalty and preferences, increasing the demand for their products.Changes in expectations can also influence demand; for example, positive reviews heightening expectations for a play can lead to an increased demand for tickets. Additionally, expanding into new communities to reach more potential buyers is a strategy businesses employ to boost demand. An increase in demand causes the entire demand curve to shift to the right, while a decrease in demand results in a leftward shift.
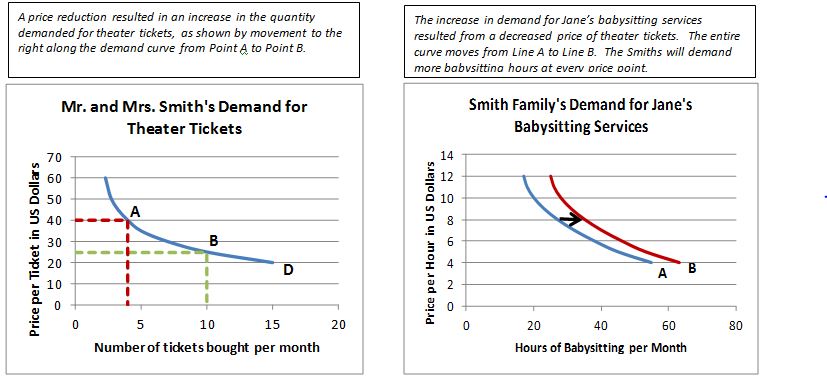
Contrastingly, a change in the quantity demanded occurs only when there is a change in the price of the good or service. To illustrate this distinction, consider the Smiths, who, upon discovering a price drop from $40 to $25 per theater ticket, decide to increase the number of tickets purchased from four to ten per season. This change in the quantity demanded is depicted by a movement along the demand curve.
The Smiths have a three-year-old daughter and use Jane to babysit when they attend plays. Their demand for Jane’s services just increased due to the drop in ticket prices. Theater tickets and babysitting are complements. Note that Jane has kept her pricing the same. The demand for her services increased at all prices. This increase in demand is illustrated by a rightward shift in the demand curve for babysitting from Demand curve A to Demand curve B.
Here is a brief video explaining the Change in Demand.