Change in Quantity Supplied
View FREE Lessons!
Definition of Change in Quantity Supplied:
A change in quantity supplied is the change in the quantity a producer is willing to supply when there has been a change in the market price of the good or service it sells.
Detailed Explanation:
A company’s supply curve illustrates the number of goods and services the company is willing to supply at every price. A point on the supply curve represents the amount a producer is willing to provide of a good or service at a specific price. A supply curve slopes upward because higher prices result in higher profits and induce suppliers to increase production. The supply curve also assumes the production process and outside influences are held constant, including the technology, input costs, regulations, the number of firms in the industry, future expectations, regulations, and tax rates. A change in any of these results in a new supply curve, which economists refer to as a change in supply.
Any alteration in these factors results in a new supply curve, termed a “change in supply” by economists. It is imperative to differentiate between a change in the quantity supplied and a change in supply, as illustrated in the accompanying graphs. In Graph 1, Jane, a babysitter, is willing to babysit for 35 hours per month at $8.00 per hour but would extend her services to 37 hours per month if the price increased to $9.00 per hour. Here, the quantity supplied increases by 2 hours per month solely due to the ability to charge a higher price. This change in price results in an increase in Jane’s quantity supplied, as illustrated by movement along the supply curve from A to B.
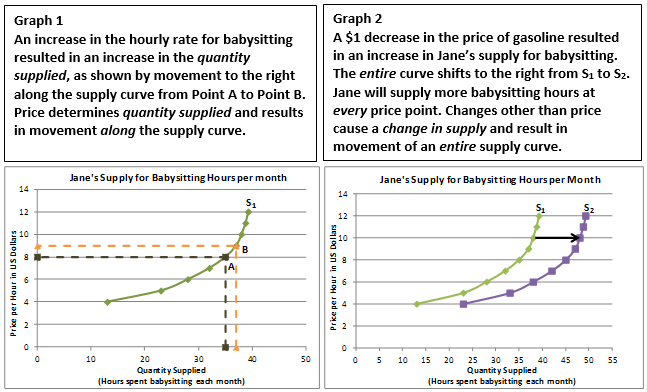
The primary catalyst for a change in supply often stems from alterations in the cost of providing a good or service. Technological advancements or fluctuations in input costs can significantly impact the manufacturing cost of a product. When the cost to produce a good decreases, manufacturers are more inclined to supply greater quantities at all price levels. For instance, if the price of gasoline drops by $1.00 per gallon, a babysitter like Jane might be motivated to extend her services. In this case, Jane is willing to increase her babysitting hours from 35 to 45 per month, even without adjusting her price. The rightward shift in her supply curve on Graph 2 depicts this willingness to supply more at each price.
An easy test to identify whether there would be a change in supply or a change in the quantity supplied is to ask, “Would a producer change the amount supplied if there is no change in price?”. If the answer is “Yes,” then there would be a change in the supply. “No” means there is a change in the quantity supplied.
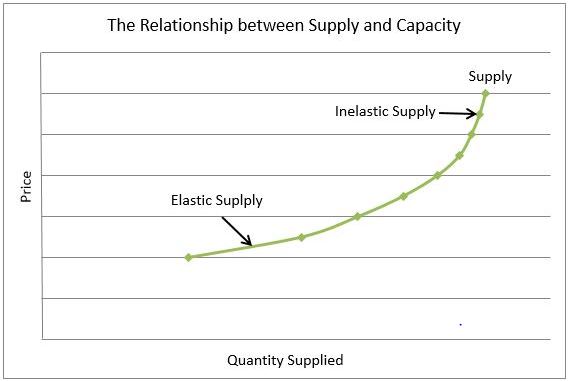
The magnitude of the increase in the quantity supplied in response to a slight price increase hinges on the producer’s price elasticity of supply. Companies with an elastic supply exhibit a swift and aggressive response to price changes, possibly due to excess capacity that allows quick adjustments such as hiring additional workers. Conversely, companies with an inelastic supply curve are less responsive to price changes, especially if they are already operating near capacity and cannot swiftly expand production in response to a price increase.
Dig Deeper With These Free Lessons:
Supply – The Producer's Perspective
Change in Supply – When Producer Costs Change
Price Elasticity of Supply – How Does a Producer Respond to a Price Change
Supply and Demand – Producers and Consumers Reach Agreement