Profits increase when a company’s cost to produce and deliver a good or service decreases. Lower manufacturing costs lead to higher profits, prompting companies to increase production even if the price remains unchanged. Conversely, manufacturers will reduce the supply of goods and services if production costs rise without a corresponding price increase. Any event that changes a company’s manufacturing costs will affect the supply of that good or service. Technological advances, lower input costs, tax cuts, subsidies, and more lenient regulations decrease a manufacturer’s costs and encourage higher production levels. On the other hand, higher input prices, tax increases, and costly regulations raise costs and reduce supply.
Factors other than direct costs, such as the cost of related products, can also influence businesses to alter their production to maximize expected profits. For example, if the price of corn increases, farmers might choose to substitute corn for soybeans. The opportunity cost of planting soybeans has increased, leading farmers to plant fewer acres of soybeans and more of corn. The entry and exit of firms in an industry also change market supply. Political disruptions and natural disasters may impact supply as well.
Suppliers are willing to increase production at higher prices, ceteris paribus. This results in an increase in the quantity supplied, rather than an increase in the supply. Changes in quantity supplied are represented graphically by movement along the existing supply curve, whereas a change in supply causes the entire supply curve to shift.
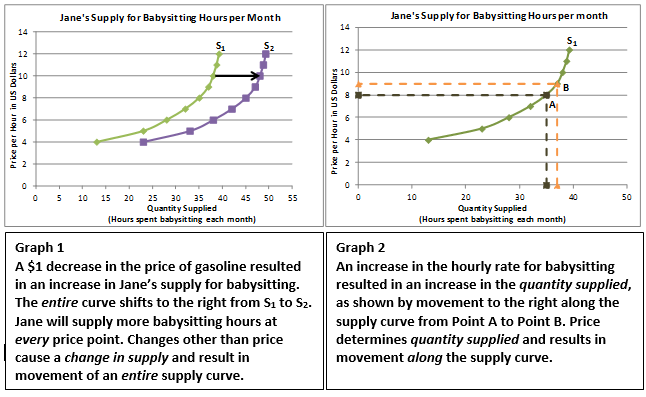
To illustrate the distinction between a change in supply and a change in the quantity supplied, assume the price of gasoline decreases by $1.00 per gallon. Jane, the babysitter, is thrilled. She can now expand her market since it is less expensive to travel to clients’ homes. Jane would be willing to increase the number of hours she babysits at every price along the supply curve. In other words, Jane’s supply curve shifts to the right. Graph 1 below shows that before the decrease in gas prices, she was willing to babysit 35 hours per month at $8.00 an hour, and after the drop in gas prices, she is willing to babysit 45 hours a month without increasing her fee.
Jane would also be more willing to increase the number of hours she babysits if she can raise her price. In this case, we have movement along the supply curve. For example, if Jane could charge $9.00 an hour, she would be willing to babysit 37 hours per month, as shown in Graph 2.
Changes in Supply – When Producer Costs Change
Changes in Demand – When Consumer Tastes Change
Supply – The Producer's Perspective
Price Elasticity of Supply – How Does A Producer Respond to a Price Change
Supply and Demand – Producers and Consumers Reach Agreement