The consumer price index (CPI) is the most commonly used index that measures inflation. It calculates inflation by comparing the weighted average cost of a market basket of goods and services widely used by an urban family over a period of time.
Many different market baskets are used to measure inflation. The consumer price index (CPI-U) uses a basket of goods and services commonly purchased by an urban family. It is the most common measure of inflation because it is the broadest index that includes over 90 percent of the US population. Another basket includes goods and services sold in the wholesale market. Changes in the cost of this basket determine the producer price index (PPI). The PPI measures inflation from the perspective of the sellers. Inflation and inflation indexes, such as the CPI or PPI, differ in their scope. Inflation reflects the overall economy, while indexes measure inflation for specific groups.
Economists use indexes to compare price levels between any two years and assess how inflation impacts particular groups. The cost of the market basket has already been determined and factored into the index, so only the CPI is needed to calculate an inflation rate. Every month, the Bureau of Labor Statistics releases the latest CPI. For example, if the CPI is 101 in year 2 and 129 in year 22, we know that prices have increased. We can calculate the percentage change between the two values to determine the inflation rate between the two years without researching the cost of each year’s market basket. Using an index, like the CPI, enables a quick determination of the period’s inflation. Visit the Bureau of Labor Statistics website for detailed reports and tables.
Assume the price of milk has increased from $0.95 to $3.00 between June 1965 and June 2024. Is milk more or less expensive in 2024 after adjusting for inflation? We can use the calculator furnished by the Bureau of Labor Statistics at the link below to express the 1965 price of milk in 2024 dollars. This calculator determines the change in a dollar’s value over time by using the CPI.
BLS - CPI Inflation Calculator
Enter the June 1965 price ($0.95) for the price during the year of origin (1965) and enter June 2024 as the end year. A gallon of milk in 1965 cost $9.45 in 2024 dollars. Since this is more than 2024’s price of approximately $3.00 a gallon, we can conclude that the price of milk has increased less than the general inflation rate, and milk was relatively less expensive in 2024 than in 1965.
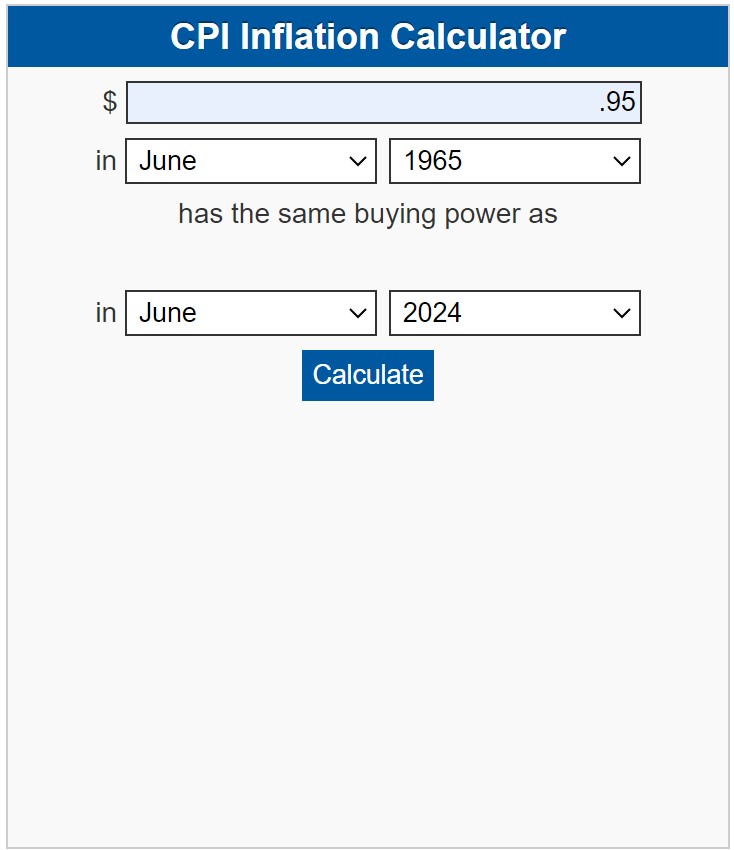
This image was copied directly from the Bureau of Labor Statistics website.
Calculating the inflation rate is theoretically simple: compare the prices of two periods, and the change in the average price equals the inflation rate. However, in reality, the task is daunting. The challenge lies in determining which items and prices should be used to obtain a representative sample. Surveys of 6,000 housing units and 22,000 retail establishments in 75 urban areas are compiled. The government employs “imaginary” market baskets that contain a standard set of goods and services commonly purchased by consumers. The inflation rate is the percentage change in the total cost of the two identical baskets from two periods.
When calculating the US consumer price index, the Bureau of Labor Statistics faces the challenge of determining the contents of the market basket. If the items in the basket don’t accurately reflect what consumers typically purchase, the resulting inflation rate will be inaccurate. Currently, the market basket used to calculate the CPI consists of around 200 categories grouped into the eight groups listed below. The government assigns a weight or reletive importance to each category based on the probability of it being purchased. For instance, items like food, which are bought more frequently than clothing, are given a higher weight. Below is a pie chart displaying the market basket groups and their relative importance as of July 2024.
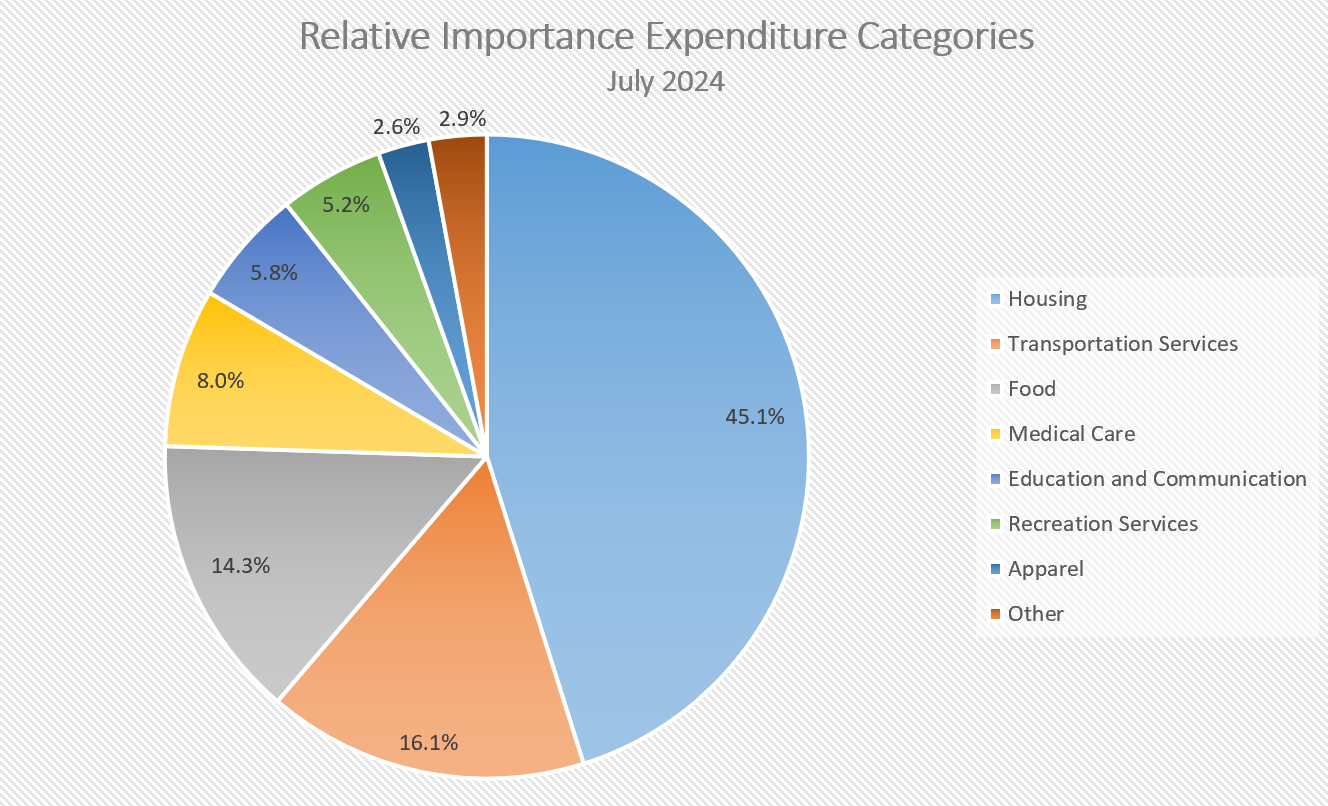 Source: Bureau of Labor Statistics
The CPI has several limitations. First, it assumes all of us share the same spending patterns and maintain those spending patterns every month. When the spending patterns assumed do not reflect the actual spending patterns of a group, the cost of living may be inaccurate for the group. For example, consider two families: one in relatively good health and another with multiple serious illnesses. If medical expenses increase at a faster rate than the general inflation, the cost of living estimate would be too low for the healthy family and too high for the unhealthy family.
The CPI accounts for changes in spending patterns over a short period. When the price of a good rises relative to inflation, consumers tend to buy fewer of that good. Instead, they may choose to purchase a different substitute. However, this change in buying behavior should be accounted for in the market basket used to calculate the CPI.
Changes in population demographics and preferences may shift alongside technological advancements, prompting adjustments to the market basket used for calculating the CPI. For example, the widespread adoption of smartphones has led to a decline in landline phone usage. Furthermore, consumers are increasingly health-conscious regarding their activities and dietary choices. As a result, the market basket utilized in CPI calculations is regularly updated to account for these evolving consumer behaviors over extended periods of time.
Finally, the CPI does not take into account changes in quality over time. For instance, in the 1970s, a car may have cost $2,000 and lasted an average of three years. Today, a similar vehicle may cost $20,000 but last for eight years. The CPI would compare the prices of these two cars without considering the difference in quality.
Inflation
Gross Domestic Product – Measuring an Economy's Performance
Causes of Inflation