A demand curve is a graph showing how much of a good or service consumers would purchase at different prices over a specified period of time.
You can create an individual demand curve for any good or service. Start by preparing a demand schedule, a table showing how many units of a good or service you would purchase at different prices over a specified period. For example, create a table showing the number of soft drinks you would buy monthly if the price per can were $0.25, $0.50, and $1.00. Next, plot the data on a graph, with the price on the vertical axis and the quantity demanded on the horizontal axis.
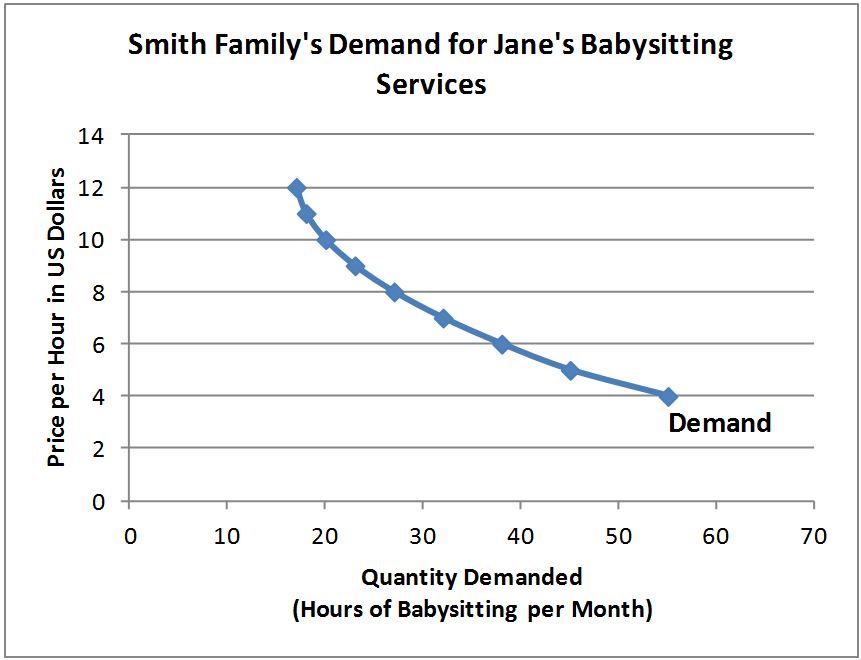
Your demand curve for soft drinks will likely slope downward, reflecting that you would buy fewer cans at higher prices. For instance, you might substitute water for soft drinks as the price increases. This downward slope illustrates the law of demand, which states that all else being equal, the price of a good and the quantity demanded are inversely related: as the price rises, the quantity demanded decreases, and as the price falls, the quantity demanded increases.
The demand curve below demonstrates this principle for babysitting hours in the Oak Grove community. At a rate of $10 per hour, 20,000 hours are demanded. However, if the price drops to $5 per hour, the quantity demanded increases to 45,000 hours.
The demand curve can shift when external factors influence consumers’ willingness to buy a good or service at all price levels. These factors include changes in the price of related goods (substitutes or complements), changes in income, shifts in tastes or preferences, changes in future expectations, or changes in the number of consumers. An increase in demand shifts the curve to the right, meaning more of the good or service is purchased at every price. Conversely, a decrease in demand shifts the curve to the left, indicating less is purchased at every price.
It’s important to note that a change in the price of the good itself does not shift the demand curve. Instead, it results in movement along the demand curve, which economists call a change in the quantity demanded.
Demand – The Consumer's Perspective
Supply and Demand – Producers and Consumers Reach Agreement
Price Elasticity of Demand – How Consumers Respond to Price Changes
Supply and Demand – The Costs and Benefits of Price Controls
Managing Supply Using Tariffs, Subsidies, Quotas & Licenses
Understand a Stock's Performance Using Supply and Demand