An indifference curve is a graph showing combinations of two items that yield the same utility or satisfaction.
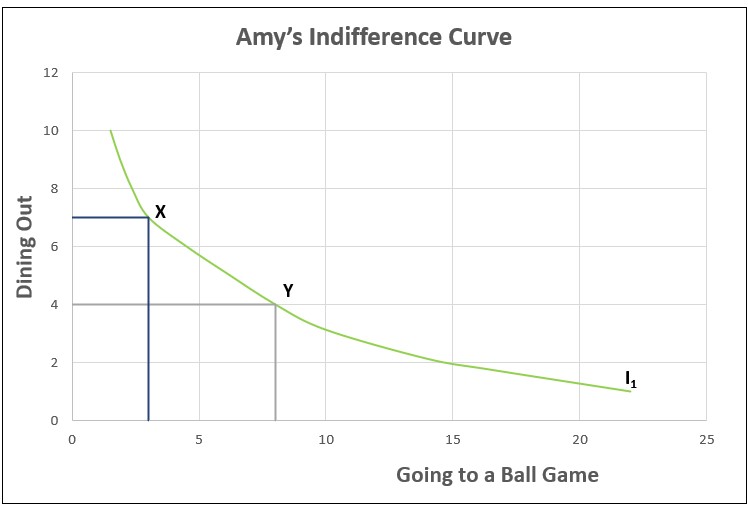
Suppose Amy’s choices of entertainment are only attending ball games and dining out. She currently goes to three games and eats out seven times a month. A friend asks her if she would prefer going to eight games if that meant she could only eat out four times. Amy’s response was. “I don’t care. I am indifferent.” These two points, X (3,7) and Y (8,4) are on Amy’s indifference curve, I1, which is plotted below. Any combination of games and meals that are on this indifference curve yields the same level of satisfaction.
Graph 1
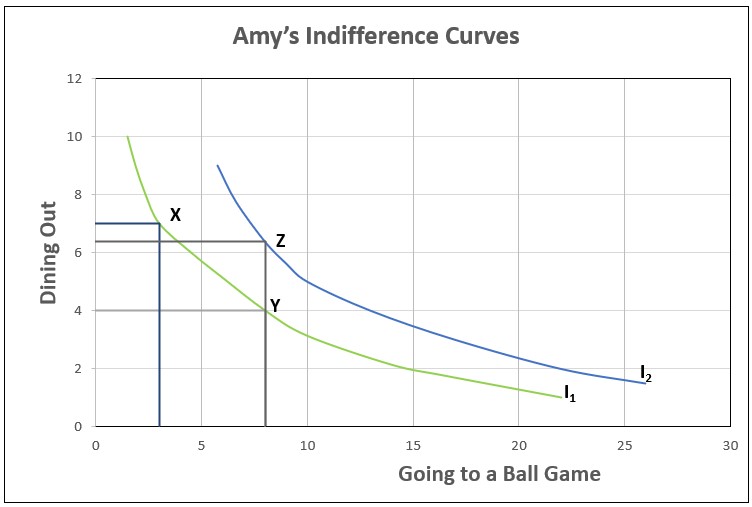
Graph 2 below is identical to I1, except I2 has been added. Amy would prefer any combination on I2 to any combination on I1 because I2 is above I1. For example, at Point Z, Amy would attend the same number of games but eat out more than she would on I1. The further from the origin an indifference curve is, the higher the utility. People have an infinite number of indifference curves, and when many are plotted on the same graph, they provide an indifference map. A person’s indifference curves cannot intersect. If they did, it would mean that the same combination of goods would provide a person with different satisfaction levels, which is impossible.
Graph 2
Indifference curves are convex, meaning they bow inward because of the law of diminishing marginal returns. In other words, as Amy dines out more, the satisfaction she gains from each meal diminishes, so she would be more interested in trading a game for eating out. Indifference curves are for an individual. I1 and I2 are Amy’s indifference curves. Another person has different indifference curves and would choose a different combination of eating out and attending games.
What combination of games and eating out would be the most satisfying for Amy? That would depend on the relative prices of the two items. Assume Amy’s budget is $100 a month. Games cost $10, and Amy spends an average of $10 per meal when she dines out. Point Y is not plausible because Amy would spend $120. Graph 3 includes a budget constraint line (BL1). Any point on BL1 is a possible combination that Amy could choose while remaining within her budget. The X-intercept assumes Amy spends her entire budget going to ball games. She could afford to attend ten games, but she would not be able to go out to eat. At the other extreme, Amy could go out to eat ten times and not attend any games. The point (0,10) is the y-intercept.
Graph 3
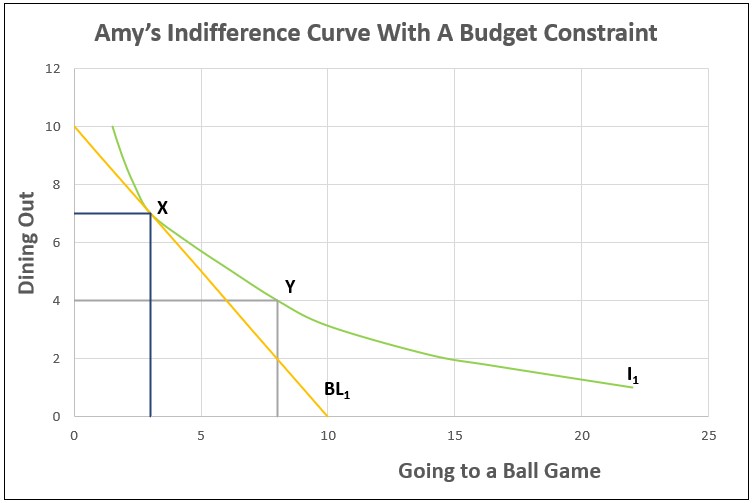
Amy would choose the combination that is on the highest indifference curve possible while remaining within her budget. That combination is where Amy’s indifference curve is tangent with her budget constraint. In Amy’s case, she would have the highest level of satisfaction if she attended three games and ate out seven times, or Point X.
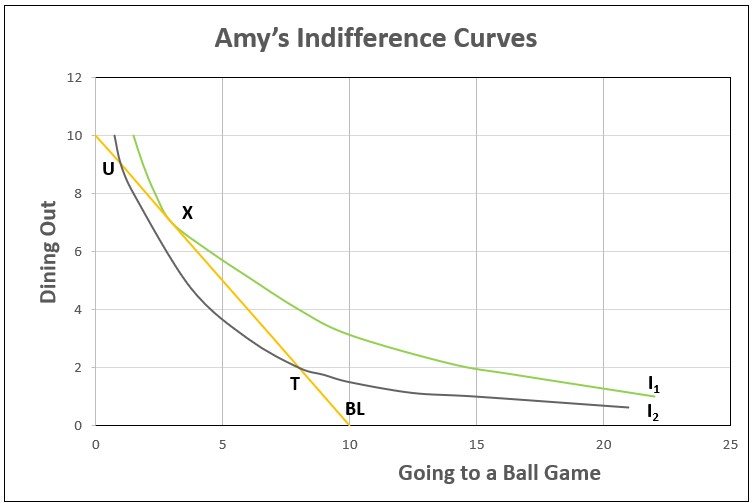
I3 has been added to Graph 4. I3 is below I1. Why wouldn’t she choose Point T or Point U. They are both on the budget constraint. Each of these points is on an indifference curve that is lower than I1, so they are less favorable. Point X is the only combination on the highest possible indifference curve that remains on the budget constraint.
Graph 4
Demand – The Consumer's Perspective
Supply and Demand – Producers and Consumers Reach Agreement
Changes in Demand – When Consumer Tastes Change
Price Elasticity of Demand – How Consumers Respond to Price Changes