Liquidity Preference Model
View FREE Lessons!
Definition of Liquidity Preference Model:
The
liquidity preference model is a model developed by John Maynard Keynes, which demonstrates his theory that the demand for cash (liquidity) that is held for speculative purposes and the money supply determine the market rate of interest.
Detailed Explanation:
Would a higher interest rate entice you to deposit more money in a savings account? If you answered “Yes”, you have shown how the law of supply and demand applies to money. The liquidity preference model demonstrates how the speculative demand for money and the supply of money influence interest rates. The model evaluates household and business preferences for liquid funds, so when studying this model, it is helpful to consider only the most liquid non-interest-bearing forms of money such as demand deposits and cash.
Keynes assumed people prefer holding cash and must be paid interest to give cash up. The possible interest earned is the opportunity cost of holding onto money. Investors would need to be paid a higher rate of return to entice them to accept a greater risk and reduced liquidity. Thus, long-term investments of the same risk normally pay a higher interest rate than short-term investments. For example, a six-month treasury bill normally has a lower interest rate than a five-year treasury note. Furthermore, investors must be compensated for taking a greater risk. For example, a 20-year treasury bond would have a lower rate than a 20-year corporate bond from a company with a poor credit rating.
Demand for Money
The demand curve for money is also referred to as liquidity preference. It is the sum of the transactional, emergency, and speculative demands for money at different interest rates.
How do you allocate your money when you get paid? Usually, households deposit most of their paycheck in a non-interest-bearing checking account which they use to pay their monthly bills. How much cash do you retain? How much do you invest in savings or an IRA? The amount probably depends on your anticipated expenses. Higher-income families spend more, so they have a need to withhold more for transaction purposes. Businesses need enough cash to meet payroll and other monthly expenses. The frequency people are paid also influences the demand for money used in everyday transactions. People who are paid once a month generally keep more in their checking account than those who are compensated weekly. The demand curve for transactional funds is very inelastic, meaning a higher interest rate will have a negligible effect on the amount of funds a household or business sets aside for transactions. For example, would you eat less if interest rates increased? Probably not!
The need to have emergency funds readily available also influences the demand for cash. Financial planners recommend allocating some money for emergencies. These funds should be held in very liquid accounts because access is usually needed shortly after the emergency. Economic expectations influence this demand. For example, during recessions households hold more cash in case a family member loses a job. A family is unlikely to invest these funds if interest rates increase. In other words, the demand for emergency funds is also very inelastic.
Because the transactional and emergency demands are inelastic, it is the speculative demand that has the greatest impact on interest rates. Speculative demand is that portion of money that is held for future investments. Investors may hold onto cash because they are reluctant to tie up investment capital if they expect a more profitable opportunity in the future. But there is an opportunity cost for holding cash, and that is the interest lost. That cost increases as interest rates rise. For example, a person is more likely to invest in a short-term CD or savings account when interest rates are high than when they are very low. The demand for speculative money is more elastic than transactional or emergency money because people normally invest more of their cash at higher rates.
It is important to distinguish between money and wealth to understand the demand for speculative money. Few of us would ever turn down money, but if given enough money, most of us would invest some or all of it in an asset that adds wealth. Assume you inherit $20,000. Your wealth would increase by $20,000, but the amount of money (cash and money in demand accounts) you have remains unchanged if you invest it all in stocks or bonds. A liquidity preference curve is a demand curve for money because a household’s or business’s value of liquidity is the same as its demand for cash. The demand curve slopes downward because when the interest rate is high, most people invest more and hold less cash.
Supply of Money
A central bank controls the money supply, so, to simplify our analysis, we assume the money supply is fixed at the level the central bank deems appropriate. Too little money would choke the economy by not providing enough money to facilitate business. Too much money would be inflationary. (See
Causes of Inflation to learn more about the relationship between the money supply and inflation.) The supply curve for money is a vertical line M
S on the graph below. It intersects the horizontal axis at the money supply chosen by the central bank. In other words, it is assumed that the money supply is not determined by the interest rate and the demand for loans. Instead, the money supply influences the interest rate.
Market Equilibrium
The market equilibrium interest rate occurs where the money supply and the demand for money (LP) intersect, shown as I
e. As with the standard supply and demand model, a surplus occurs at prices above the equilibrium when the quantity supplied exceeds the quantity demanded. In the case of money, a surplus occurs when the central bank has provided more money than households, businesses, and governments want to hold in cash at a given rate. Market forces reduce the market rate because people respond to the higher rates by seeking to invest more of their cash. They may invest money in savings or purchase a CD or bond. Banks can reduce their rates because of the excess supply. As the interest rate falls, people will want to hold more cash. In other words, the quantity demanded of cash increases. This trend continues until the equilibrium rate is met where the amount of cash demanded equals the money supply.

Market forces also push rates back to equilibrium when the interest rate is less than equilibrium and there is a shortage of money. People prefer holding more cash at a lower rate. They may withdraw their savings or decide not to reinvest in another CD when their CD matures. In response, banks raise their rates to prevent this run and attract additional funds to lend. Bondholders may sell their bonds to obtain the additional cash. All these activities push the market rate back to I
e.
Shifting Demand Curve and Supply Curve
What would cause a shift in a household or business’s liquidity preference? Anything other than a change in the interest rate that leads consumers or businesses to retain or invest a larger portion of their money would cause a shift in the demand curve for money. When a family’s income increases, spending is also likely to increase, so it will need more money for everyday transactions. On-line banking, debit cards, and ATMs (automated teller machines) have made it much easier to deposit and withdraw money from banks. These technologies have reduced the opportunity cost of depositing more money and shifted the demand curve for money to the left. In other words, most of us hold less cash at every interest rate because accessing our money is easier than it was twenty years ago.
An increase in the price level shifts the demand curve for money to the right. People need more money to purchase a given basket of goods following an increase in the price level.
Monetary Policy Implications
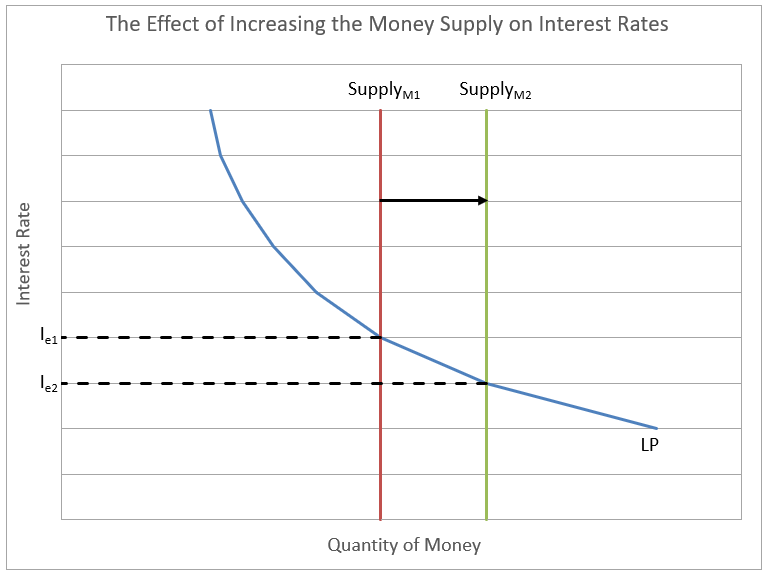
This model illustrates how a central bank can influence the market interest rate by increasing or decreasing the money supply. The graph below shows how an increase in the money supply from Supply
M1 to Supply
M2 results in the market interest rate dropping from I
e1 to I
e2. When money is added to the economy, people accumulate cash, so they deposit it in their banks until they identify an investment or need. Banks can lower their rates and still attract deposits.
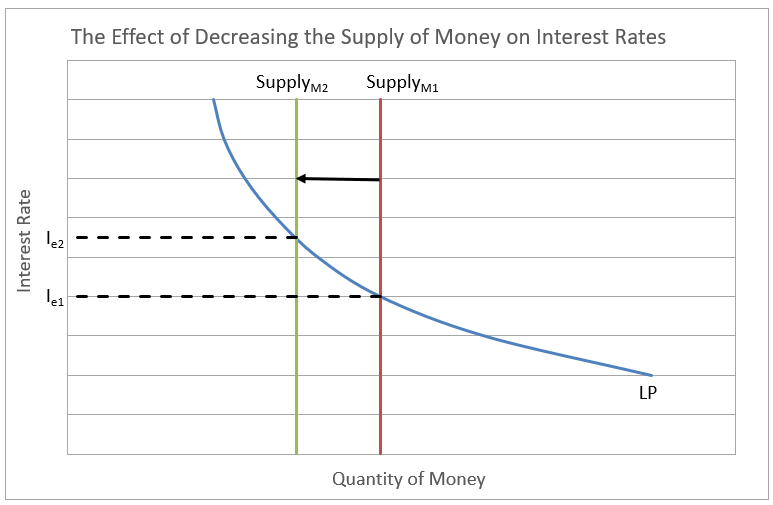
Reducing the money supply pushes up interest rates. In this case, the money supply shifts from Supply
M1 to Supply
M2, and the interest rate rises from I
e1 to I
e2. (It is important to note that the money supply itself rarely decreases, but this policy can be used to reduce the rate of growth of the money supply. However, it is easier to understand this concept when an actual decrease in the money supply is assumed.)
Dig Deeper With These Free Lessons:
Monetary Policy – The Power of an Interest Rate
Causes of Inflation
Fractional Reserve Banking and the Creation of Money
Fiscal Policy – Managing an Economy by Taxing and Spending
Price Elasticity of Demand – How Does a Consumer Respond to a Price Change