Loanable Funds Model
View FREE Lessons!
Definition of Loanable Funds Model:
The
loanable funds model is a model that uses supply and demand to illustrate how an interest rate is determined by the interaction between savers who supply money and investors who borrow money.
Detailed Explanation:
Savers or investors supply money to fund economic growth. Borrowers use (demand) the money provided by savers (suppliers) to fund their needs and compensate the saver (interest) for using their money. Bankers are both borrowers and investors. When you deposit money in a savings account you are an investor and the banker is borrowing your money. The bank pays you interest for the use of your money. The bank then becomes an investor by using your money to lend to consumers and businesses. For a bank, loans made to borrowers are investments, and banks expect to be paid interest for the use of their money. Savings, (investment), and borrowed money must be equal because whenever there is an investor (saver), there is a borrower. (Visit
Monetary Policy – The Power of an Interest Rate to review the math proving that savings must equal investment.)
Demand for Loanable Funds
A local car merchant may advertise one percent car loans. Why? Lower payments sell more cars. Likewise, lower mortgage rates raise the demand for houses because the resulting lower payments spur homebuyers to purchase larger homes sooner. The demand curve for loanable funds slopes downward because consumers and businesses would be willing to borrow more at lower interest rates. When graphing a demand curve, the market interest is on the vertical axis because interest is the price of money. The quantity of loanable funds is on the horizontal axis. Economists use real interest rates to minimize the impact of inflation on their analysis.
Assume you manage a large company and you are considering expanding into a new product line with an expected real return on investment of eight percent. Your only source of capital is a bank loan. Would you make this investment if your bank had a real interest rate of nine percent? Probably not. The bank’s interest rate exceeds your expected return, so your net return would be negative. Now assume the bank suddenly drops its rate to three percent. Would you make the same investment? Probably, because you now have a positive return of five percent. More projects become financially viable at lower interest rates, again illustrating the inverse relationship between interest rates and the demand for loanable funds.
Sources of credit include banks, credit card companies, mortgage companies, or any other lending institution. Credit is also supplied through the bond market, where large companies and governments sell bonds as a way of borrowing the money they need to finance a budget deficit. However, the government’s demand for borrowed funds is very inelastic because a government’s demand is based on need and is not influenced by the interest rate. I have never heard a politician recommend investing in a project because interest rates are low!
Supply of Loanable Funds
Interest rates and the supply of loanable funds are directly related. In the liquidity preference model, John Maynard Keynes contends that people prefer holding cash and must be paid to give cash up. Higher interest rates entice people to invest more than lower interest rates because the opportunity cost of having money sit idle increases. Two large suppliers of loanable funds include banks, when they originate loans, and investors when they purchase interest-bearing assets such as bonds or certificates of deposit. For example, investors frequently switch some of their stock portfolios to bonds following an increase in interest rates. A central bank can also directly influence the supply of money available for credit by increasing or decreasing the money supply.
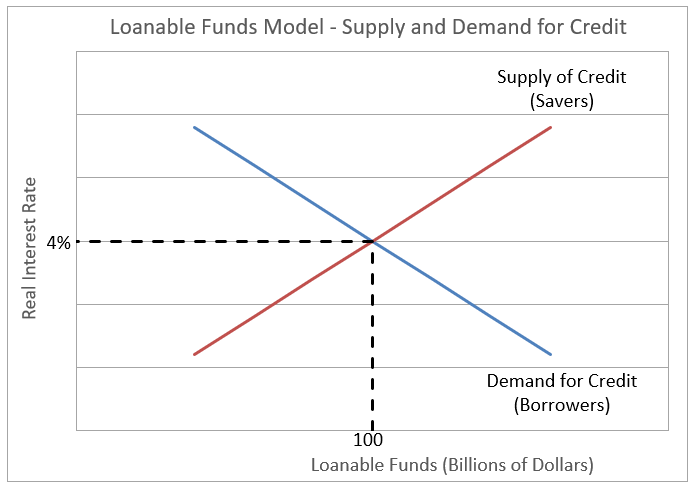
The graph below is a supply and demand graph, where four percent is the equilibrium real interest rate and $100 billion equals the loanable funds made available at four percent. (The implication is that there is only one market rate. Clearly, this is false because there are literally thousands of interest rates. However, all rates tend to move in sync, so students should view this as an average real interest rate.)
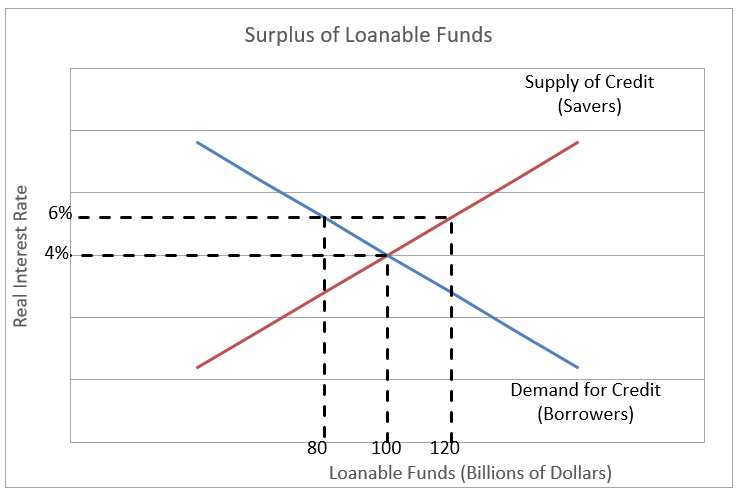
There is a surplus of money available to lend when the real interest rate exceeds the equilibrium rate. For example, assume the interest rate equals six percent. The total demand for loanable funds would drop to $80 billion. Why? Perhaps the higher borrowing cost discourages some businesses from proceeding with a project. Households may not qualify for a mortgage at a higher rate. But at ten percent, people would save more, thereby increasing the quantity of money available to lend. In our example, savers would be willing to provide $120 billion in loanable funds. Savers would either drop their acceptable return or hold onto cash. The graph below illustrates the surplus of available funds when the real interest rate equals six percent.
The market forces are reversed when the interest rate is less than the market equilibrium. The lower rate makes more projects profitable. Many businesses would seek financing, but the low rate discourages savings, so there would be a shortage of loanable funds. Borrowers would bid up the interest rate until suppliers of credit (savers) would be in equilibrium with those that demand credit (investors).
Shifts in The Supply or Demand Curves
Anything that affects the demand for loanable funds except a change in the interest rate will cause a shift in the demand curve. For example, an increase in borrowing resulting from an improvement in consumer or business confidence would cause the demand curve for loanable funds to shift to the right. When a central bank adjusts the money supply it will cause a shift in the supply curve. Shifts in the supply of loanable funds can also be caused by anything that affects savers’ willingness to save other than a change in the interest rate. Government policies, including new IRA laws or tax changes that promote savings, will increase the supply curve.
Dig Deeper With These Free Lessons:
Monetary Policy – The Power of an Interest Rate
Fractional Reserve Banking and the Creation of Money
Fiscal Policy – Managing an Economy by Taxing and Spending
Capital – Financing Business Growth