M1 is the most limiting measure of the money supply. It includes only the most liquid assets that are widely accepted for payment, such as currency in circulation, demand deposits, and other checkable deposits (OCDS).
There are several measures of money. Cash is accepted everywhere. But what about a savings account, certificate of deposit, or retirement account?
Money is an asset used to purchase goods and services and pay debts. M1 includes money readily accepted as payment that does not have to be sold or exchanged for cash before buying a good or service. It includes cash, demand deposits (checking accounts), and other deposits with check-writing privileges that can be withdrawn anytime without penalty. The best test for M1 is to ask, “Would most merchants accept this as payment when buying an item in a store?” If the answer is “Yes,” it is probably included in M1. Merchants usually accept currency or a check, but not a CD, because the CD has to be converted to cash before paying for a good or service. CDs, bonds, and stocks are liquid because they can be converted into cash quickly. However, their conversion requires a sale or maturity. Economists call these assets “near money” because they are very liquid. The pie chart below provides a breakdown of the accounts included in M1.
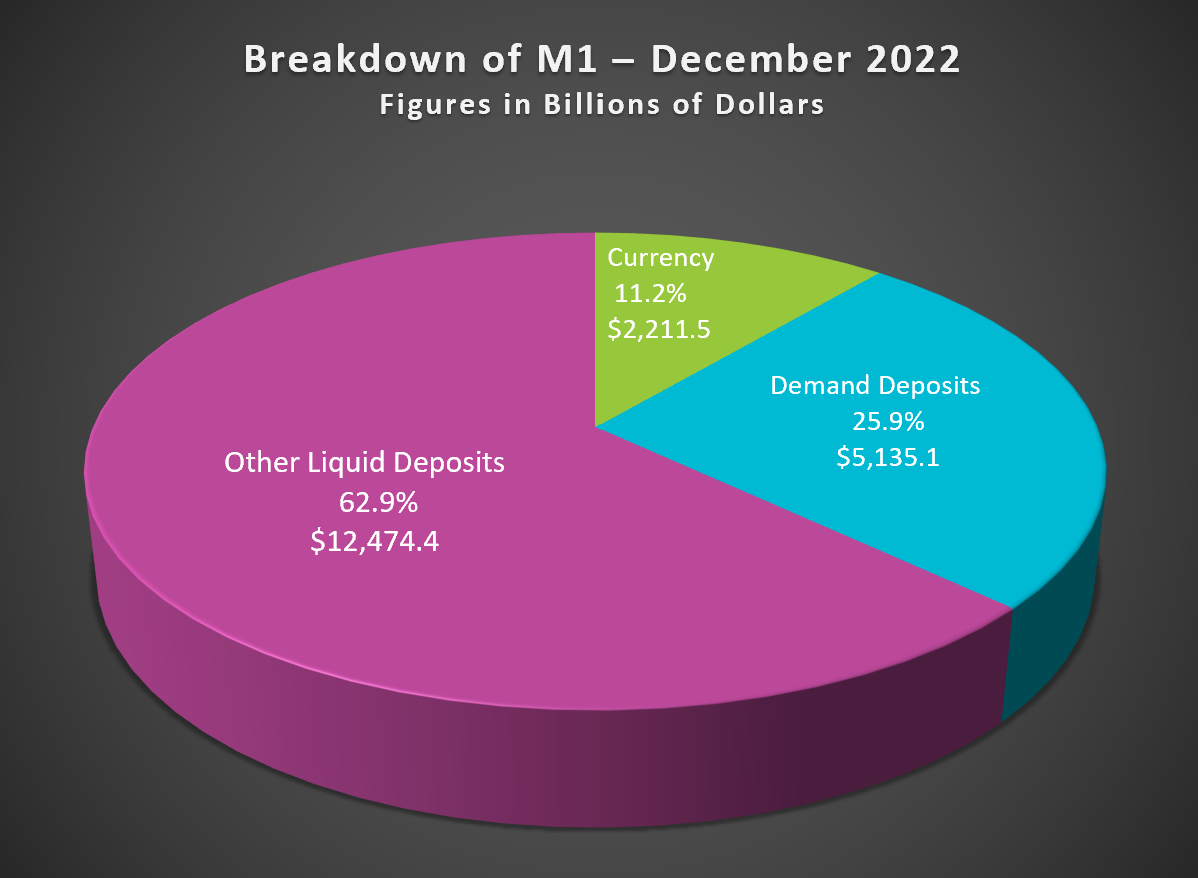
Source: Federal Reserve Money Stock Measures - H.6 Release, May 23, 2023
Before May 2020, savings accounts were less liquid than today because deposit holders were limited in the number of withdrawals they could make in a month as part of Regulation D. Few savings accounts had check-writing privileges. However, on April 24, 2020, the Federal Reserve waived the Reg D limit on the number of transactions permissible. Suddenly money market accounts and savings accounts became more liquid, and the definition of M1 was changed to include these other checkable deposits.
The graph below illustrates the growth of M1 and M2 since 2000. The graph’s enormous increase in M1 between 2019 and 2020 results from adding other transaction deposits to M1. The $1.5 trillion difference between M1 and M2 beginning in June 2020 is caused by the small-denomination time deposits without check-writing privileges and retail money market accounts included in M2 but not M1.
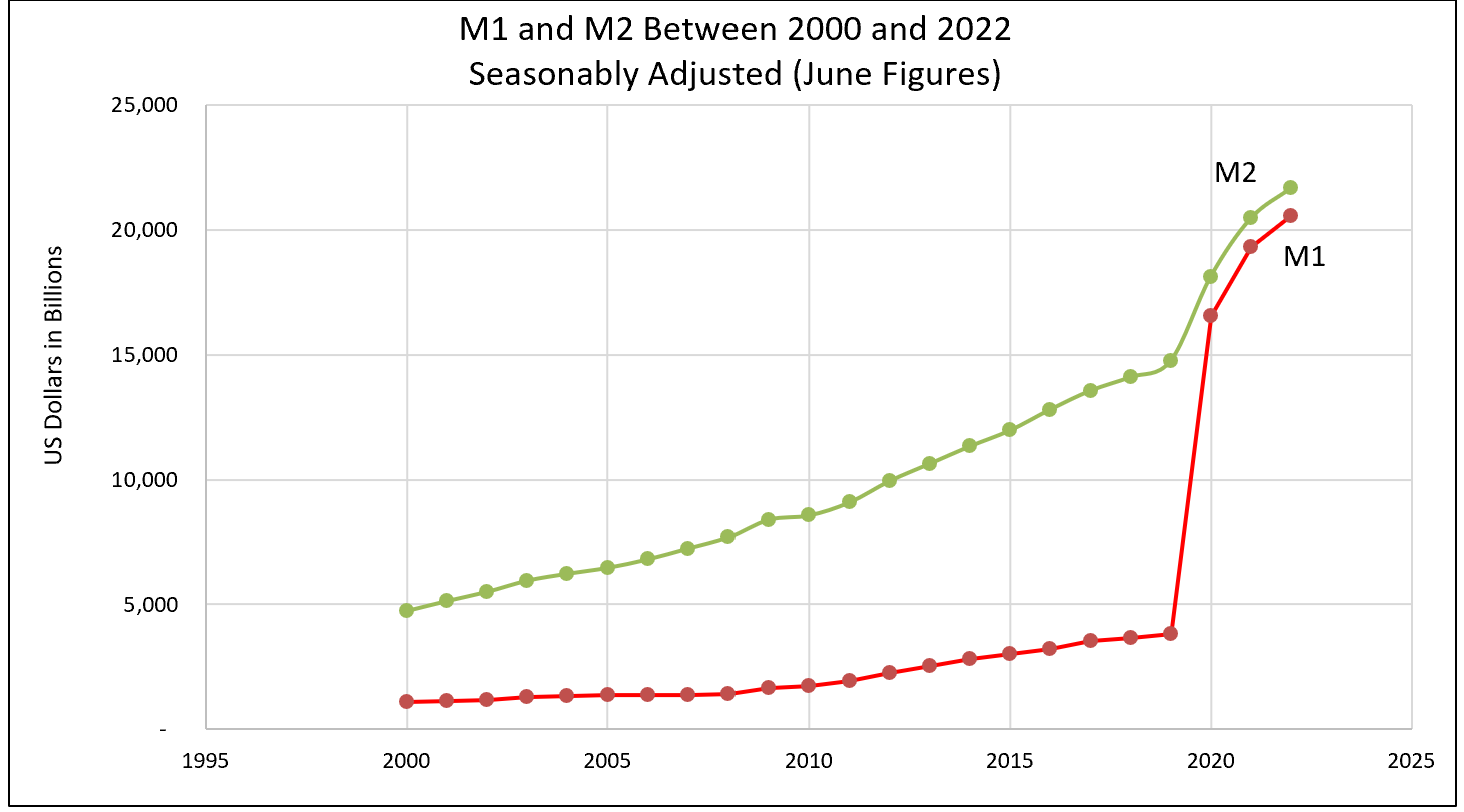
Source: Federal Reserve Money Stock Measures - H.6 Release, May 23, 2023
The sharp increase in 2020 and 2021 reflects the Federal Reserve’s addition of money to the economy during the pandemic to prevent a severe recession. The curves begin to flatten and will eventually curve downward as the Federal Reserve tightens its monetary policy to slow inflation in 2023.
Fractional Reserve Banking and The Creation of Money
Monetary Policy – The Power of an Interest Rate
What is Money