An oligopoly is a market structure with a few companies that dominate their market.
If you are shopping for cereal you may be impressed by the wide variety of choices, but chances are that if you purchase a carton, the cereal will have been produced by Kellogg’s, General Mills, or Post. Together these companies dominate the cereal industry. Each company is very aware of what each of its competitors does. In fact, because there are so few companies, their sales and profits are interdependent. The cereal industry is an oligopoly.
Oligopolies are a prevalent market structure. Airlines, smartphone providers, grocery stores, movie producers, and automobile manufacturers are just a few industries that are oligopolies. An oligopoly is a market structure with a few companies that dominate their market. These companies exert more economic power than companies in a monopolistically competitive industry, but not as much as a monopoly. Competition is intense. Price competition may result in a price war where all companies lose revenue, so the management of an oligopoly prefers to avoid competing in price.
A Few Companies Dominate
Market share is the percentage of total industry sales of a good or service controlled by a single company. A concentration ratio is the combined market share of the largest companies in an industry. It is used to measure the monopoly power of a company or industry. Normally the largest four companies are used. A high concentration ratio would be indicative of an industry with a few dominant companies. The cereal industry is an oligopoly. Its largest three companies controlled approximately 79 percent of the cereal market in 2017.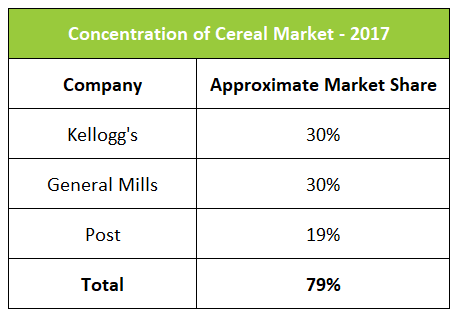 Source: Bakeryandsnacks.com August 2017
Economists generally define oligopolies as industries where the four largest companies have a concentration ratio exceeding 40 percent. Monopolies would have a concentration ratio of 100 percent because there is only one company that produces all of a good or service. Perfectly competitive industries would have concentration ratios close to zero because there are many very small firms. Finally, monopolistically competitive industries would have concentrations less than 40 percent, not high enough to be considered an oligopoly, but not low enough to be considered a perfectly competitive industry.
High Barriers to Entry
Companies are hesitant to enter an industry that is an oligopoly because of the high barriers to entry. Normally the barriers are economical. The economies of scale are such that many goods or services would need to be produced before a profit could be realized. Years of losses may be incurred prior to selling enough of a good or service to achieve a profit. The sustained losses deter potential entrepreneurs from entering the industry.
Huge investments may be required to build plants and purchase the equipment needed to manufacture a product. However, this investment may be small in comparison to the money needed to build distribution channels and market the good or service to consumers. Imagine entering the automobile industry. Large manufacturing plants must be built. The trust and support of distributors must be earned to sell the new brand of cars. Mechanics need to be trained. Most importantly, it may take years to gain consumer confidence. Consumers who like the car may not purchase it because they fear not being able to secure parts and services if the company does not survive. Clearly, the barriers to entry are very high in the automotive industry.
Product Differentiation
Oligopolies compete. Decisions made by one company in the industry affect the decisions made by all the others. Technological advances may provide a company with such a great advantage that it puts others out of business. Blackberry was at the peak of the smartphone industry when the technology to send emails over a phone was first developed in the 1990s, but Blackberry failed to keep up with its competition and fell out of favor.
Oligopolies invest heavily to build brand loyalty. Normally advertising emphasizes the attributes of a product rather than price. Cereal companies market their taste, health benefits, or perhaps a toy in the box. Rarely do you see an advertisement for a cereal company mention price. Soft drink and food companies promote their taste and social appeal, with scenes of popping open a soft drink at a party. Detergents peddle cleanliness and smell rather than price.
Pricing and Output
Oligopolies have some pricing power, but they are constrained by their competitors. If an oligopoly raises its price too high, consumers will purchase a substitute good from a competitor. However, if an oligopoly chooses to lower its price, it risks inciting a price war where competitors will lower their prices to protect their market share.
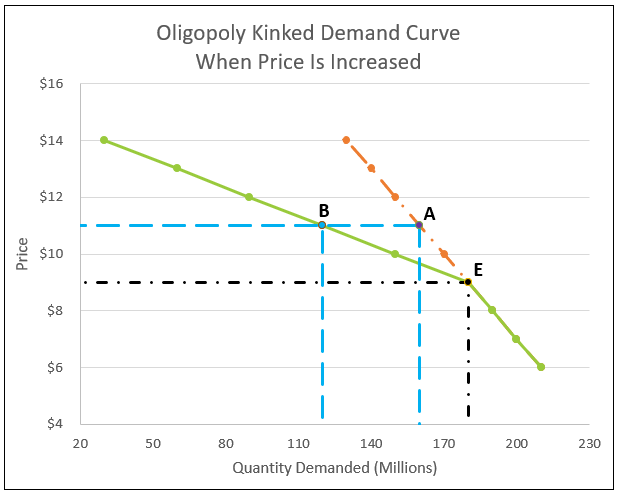
Individual companies within an oligopoly have kinked demand curves. The kink occurs at the market price. It is assumed that if an oligopoly raises its price its competitors will not match the increase and the company will lose market share.
The graph below shows why companies in an oligopoly are reluctant to raise their prices unless all the companies in the oligopoly do so. Assume Company One is in an oligopoly. It sells a product for $9. At $9 per unit, Company One sells 180 million units (Point E) for a total revenue of $1.62 billion. Hoping that its competitors will follow its lead, management increases its price to $11. Management expects sales to fall to 160 million units (Point A), and for revenues to increase to $1.76 billion. Instead, competitors do not match the price change and many consumers purchase a lower-priced substitute. At $11, Company One’s sales decrease to 120 million units (Point B) and total revenues decrease to $1.32 billion. Above $9, the company’s demand curve becomes more elastic because competitors do not match a price increase.
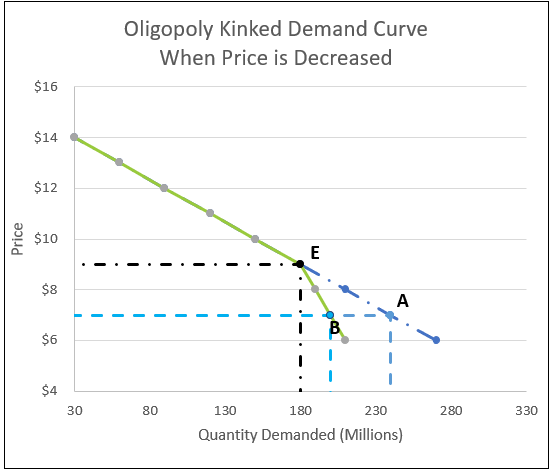
The graph below explains why companies in an oligopoly fear lowering their prices and only the most aggressive companies would use this strategy to increase their market share. Assume Company One’s management believes it has a superior product and can build brand loyalty after consumers try it. As the above graph, the initial market price is $9 and 180 million units are produced (Point E). Instead of raising its price, management reduces its price to $7, hoping to increase Company One's sales from 180 to 240 million units and revenues from $1.62 to $1.68 billion (Point A). Some of Company One’s competitors respond by matching or even exceeding the reduction in price to protect their market share. Company One’s sales increase, but only to 200 million units (Point B). Revenues decrease from $1.62 to $1.40 billion.
Price wars occur when companies in an industry continually lower their prices to gain market share. Typically, one company begins the downward spiral by lowering its price. Competitors follow rather than lose market share. For example, one airline may offer an attractive price to attract travelers when it first enters a market. Competing airlines may match or even lower the price to discourage travelers from switching airlines. Determined to attract passengers, the airline entering the market may further lower prices. The downward price spiral continues!
So how do oligopolies adjust their prices? Ideally, they would get together and agree to restrict output to the same as a monopoly. This is collusion, and in most cases, collusion is illegal. Collusion occurs when two or more companies agree on either prices or output with the objective of maximizing the profits of all the companies.
Reaching a compromise without colluding is the challenge. Frequently, one company, usually the largest, takes the lead by periodically adjusting its price. When it does, its competitors follow. This is price leadership. Press releases hinting at price increases may be a signal to competitors.
Market Structures Part II – Monopolistic Competition and Oligopoly
Market Structures Part I – Perfect Competition and Monopoly
Supply and Demand – Producers and Consumers Reach Agreement
Output and Profit Maximization