Short-term profits are maximized at the optimal production level. It is the output where the marginal revenue derived from the last unit sold equals the marginal cost to produce it.
Detailed Explanation:
Companies frequently evaluate the relationship between their revenues and costs. Does it make sense to lower the price of a good to increase sales, even if it means the cost to produce the additional unit increases? Possibly, but the short-run answer depends on the relationship between the revenue gained from the sale and the cost to produce the next item.
Imagine you own Accounting Pens, a small manufacturer of pens. Your objective, like most business owners, is to maximize your profits. You operate in a very competitive market and must accept the market price of $5.00 per pen. How many pens should you produce? If it costs $4.45 to produce one more pen, would it make sense to manufacture that pen? Absolutely! You would add $0.55 to your profit if you sold that unit. How about if your cost to produce the next pen was $5.25? Would it make sense to manufacture that pen? Probably not. In that case, you would lose $0.25 if you sold the pen.
The price (in this case, $5.00) equals the marginal revenue, or the revenue gained from selling the next pen. The marginal cost is the cost to produce the next pen. You would choose to increase production when your marginal cost equaled $4.45 because your marginal revenue exceeded your marginal cost. But in the second case, when the marginal cost increased to $5.25, you would choose not to produce any more pens because your marginal cost exceeded your marginal revenue. A basic economic concept is: profits are maximized at the production level where the marginal revenue gained from selling one additional unit equals the marginal cost to produce that additional unit. In other words, a business should continue increasing output as long as its marginal cost is less than, or equal to, the marginal revenue gained from selling the good or service.
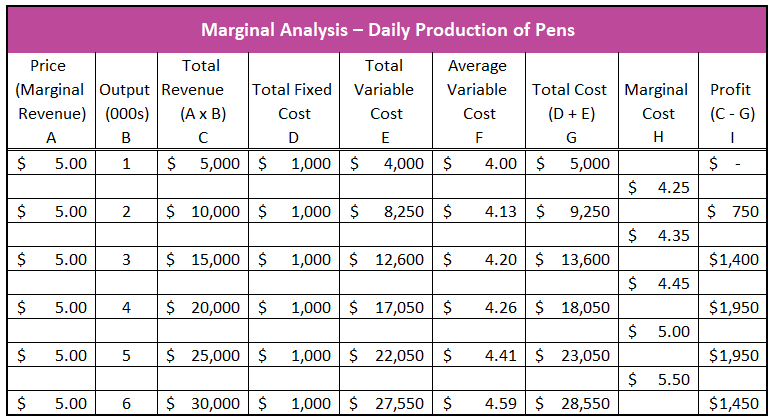
In the table below, marginal analysis is used to determine the output yielding the highest profit for Accounting Pens.
Suppose pens must be produced in minimum lots of 1,000. Also, suppose Accounting Pens operates in a perfectly competitive market and it is a price taker. Accounting Pens can sell as many pens as it produces for $5.00 per pen. Reducing its price will not generate additional sales. If each additional pen can be sold for $5.00, then Accounting Pens’s marginal revenue equals $5.00 (Column A). Total revenue (Column C) equals the price (Column A) multiplied by the number of pens sold (Column B).
Fixed and variable costs must be known to identify the most profitable daily output. Accounting Pens’s total fixed cost (Column D) is $1,000 per day. Fixed costs are constant and not influenced by output. Accounting Pens’s total variable cost is given for each output level in Column E. Note that the average variable cost (Column F) is increasing. This is because the law of diminishing marginal returns states that eventually, as variable inputs (such as labor) are added to a fixed resource, the production may increase, but at a slower rate. For example, as employees are added to Accounting Pens’s production line, production increases, but the average increase is less. (Taken at an extreme, production could decrease if employees get in each other’s way and slow down the production process.) For a more detailed explanation of the law of diminishing returns, visit the glossary.
The total cost (Column G) equals the sum of the total variable cost (Column E) and the total fixed cost (Column D). The corresponding marginal cost (Column H) ranges from $4.25 to $5.50 per pen. Marginal cost is calculated by subtracting the difference in total cost between two production levels and dividing by 1,000 because each batch contains 1,000 units. For example, the marginal cost of increasing production from 1,000 pens to 2,000 pens equals $4.25, which is the change in total cost ($4,250) divided by 1,000. The marginal cost rows have been placed between two output levels because marginal cost is the per-unit cost of increasing production from one level to the next level. In this example, "$4.25" is placed between 1,000 and 2,000 pens. The profit (Column I) at a given production level equals the total revenue (Column C) minus the total cost (Column G). The marginal analysis shows that profit is maximized when 4,000 or 5,000 pens are produced. The marginal revenue is $5.00. And the marginal cost between 4,000 and 5,000 units is also $5.00. This example illustrates that the optimal production level where profits are maximized is achieved where marginal revenues equal marginal costs. Test your understanding of cost relationships and production by completing the interactive exercise included in our lesson Output and Profit Maximization.
In the above example, a perfectly competitive market has been assumed to simplify the calculation of marginal revenue, because in perfectly competitive industries, the marginal revenue is equal to price. However, profit is also maximized when output is set where a business’s marginal revenue equals its marginal cost in imperfectly competitive industries (such as monopolies, oligopolies, and monopolistic competition). These businesses have some pricing power. Their management must balance changes in marginal revenue with changes in their marginal cost. For example, a business may lower its price to add sales, knowing that increasing production will also increase the marginal cost. It is assumed that the lower price would be for all future units sold. This is why the marginal revenue curve is below the demand curve for companies with a downward sloping demand curve.
Here's a brief video explaining Optimal Production Level
Suppose Accounting Pens is in a monopolistic competitive industry and it wants to increase sales. To do so, assume management chooses to lower the price of its $5.00 pens, resulting in a marginal revenue of $4.85. The lower price increases the quantity demanded to 6,000 pens per day. Output is increased to meet the increase in demand, but this increases the marginal cost to $6.00 per pen. Profits fall in the short run, but companies may reduce prices knowing they will not maximize their short-term profit. Instead, they lower their price as a long-run strategy to gain market share.