The personal consumption expenditures (PCE) price index measures inflation by measuring the price changes of consumer goods and services.
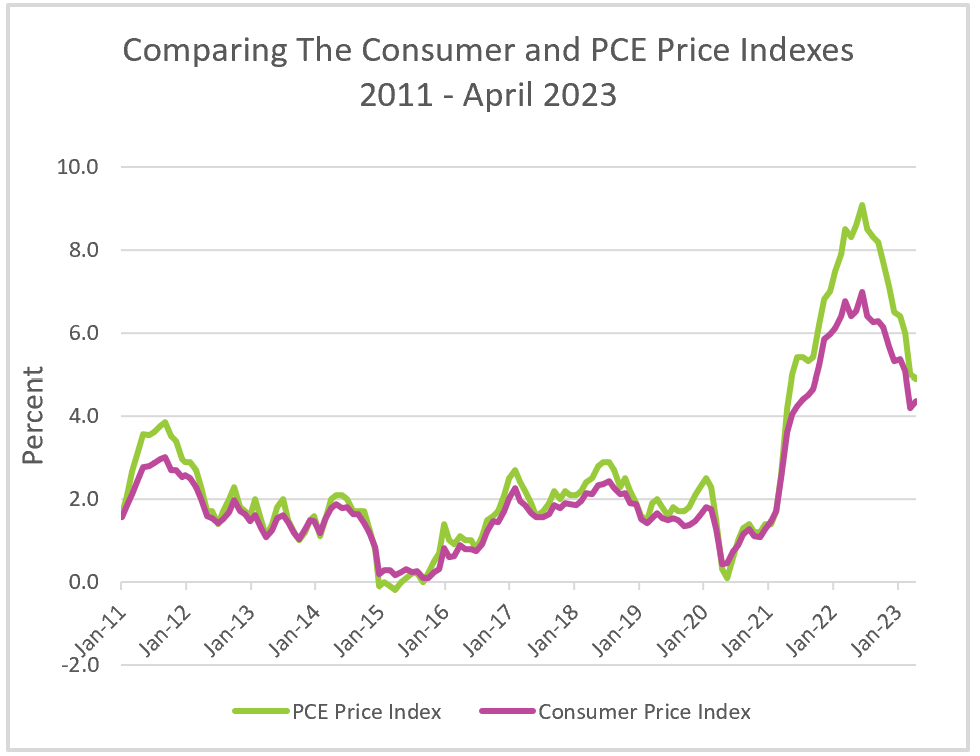
The personal consumption expenditures price index (PCE price index) and the consumer price index (CPI-U) are two commonly used measures of inflation. The CPI is released by the Bureau of Labor Statistics (BLS) and is utilized for adjusting Social Security and many contracts. On the other hand, the PCE price index, although less publicized, is considered more important as it is the preferred measure of inflation by the Federal Reserve for making economic policy decisions. The Bureau of Economic Analysis (BEA) publishes the PCE price index monthly in its Personal Income and Outlays report.
The PCE price index typically shows a lower inflation rate of about 0.3 percent than the CPI. This discrepancy arises due to differences in the calculation of the two indexes. The CPI measures the cost of the contents of an identical basket of goods and services every month. The contents are adjusted every two years to account for changing lifestyles . In contrast, the PCE price index tries to account for the substitution of items by consumers in response to changes in relative prices. For instance, if the price of beef increases and consumers switch to buying chicken, the PCE index reflects the increased demand for chicken. Consequently, the PCE basket is adjusted to include less expensive items, resulting in a lower inflation rate.
The CPI and the PCE price index both weigh expenditures according to how much consumers spend on a given category, but the weights differ. For example, the weight given to housing is more than the weight given to entertainment because most consumers spend more on housing than entertainment. The CPI gives housing prices more importance than the PCE price index. Differences in weighting also result from the sources of data and different objectives. The BEA uses business surveys when determining the weights for the PCE, and household surveys provide the data for the CPI. The CPI figure most commonly used is the CPI-U. It only includes “out-of-pocket” purchases made directly by households in urban areas. The PCE price index is more comprehensive than the CPI because it includes rural areas. The PCE price index also includes spending by third parties on behalf of households. Items, such as health insurance purchased by businesses as a benefit to their employees, are included in the PCE price index and omitted from the CPI. Households do not pay medical costs paid by Medicare or Medicaid, so they are not included in the CPI, but they are included in the PCE, resulting in health care being weighted more in the PCE than the CPI.
Both the CPI and the PCE price index have their own version of a “core price index”, which excludes food and energy. Food and energy prices can be volatile, so a sizeable short-term swing in one can lead to misleading information. The core indexes provide a more accurate picture of long-term trends. However, because people eat and fill up the tanks in their cars, the CPI and PCE price index gives a more accurate picture of what people spend than the core indexes. Read our Income and Outlays blog to monitor the PCE price index, the CPI, and the core indexes.
Gross Domestic Product - Measuring an Economy's Performance
Inflation
Business Cycles
Fiscal Policy – Managing an Economy by Taxing and Spending
Monetary Policy – The Power of an Interest Rate