The substitution effect describes the effect on the demand for a good or service when there is a price change of a related product. Consumers will purchase more of a substitute good or service that is relatively less expensive following an increase in the price of a related good or service.
A Honda dealership may have a sale to entice buyers away from a nearby Toyota dealership. Before the sale, customers were indifferent between a Honda and a Toyota, but the sale reduces Honda’s price relative to a Toyota. Many customers may choose to purchase a Honda, instead of a Toyota. This case illustrates the substitution effect because the shoppers were initially indifferent between a Honda and Toyota, but the price change prompted people to purchase a Honda because it was relatively less expensive.
The closer two items are to being perfect substitutes, the greater the potential substitution effect, assuming it is easy to switch between items. For example, Coke and Pepsi soft drinks are close substitutes. It is likely that if Coke increases its price, the demand for Pepsi soft drinks will increase because consumers will substitute Pepsi for Coke drinks.
Companies invest millions of dollars in advertising to build brand loyalty. Why? Because brand loyalty reduces the potential harm of the substitution effect. If PepsiCo reduces the price of its soft drinks, many who are loyal to Coca-Cola will remain loyal. The substitution effect only measures the influence of a price change.
Economists distinguish between the substitution and income effects. When there is a price change of one good, there will be a change in the demand of related products resulting from a buyer substituting one good for another (substitution effect) and a change in the buyer’s available income (income effect). The graphs below show the differences.
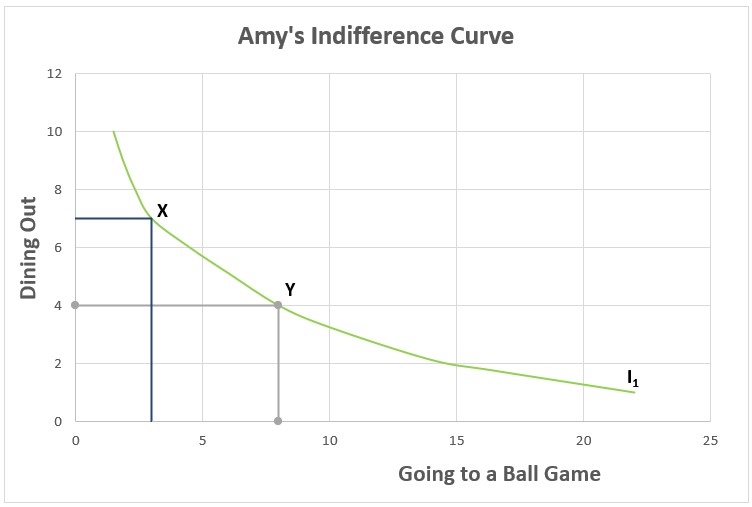
Amy’s two favorite forms of entertainment are attending ball games and eating out. She has budgeted a fixed amount of her income for these pleasures. An indifference curve is a graph that shows all the combinations of two goods (or services) that yield the same utility. In other words, Amy would receive the same satisfaction (utility) from attending three games and eating out seven times (Point X) as she would from going to eight games and eating out four times (Point Y), or for that matter, she would be indifferent to purchasing any combination that is on I1 because Amy’s satisfaction would be the same.
BL1 is Amy’s budget constraint on the graph below. Amy would spend all of her money at any point on her budget constraint. The line intersects the vertical axis where Amy spends her entire budget going out to eat. In this case, she would dine out ten times. It intersects the horizontal axis at ten games, in which case Amy’s entire budget is spent on attending ball games.
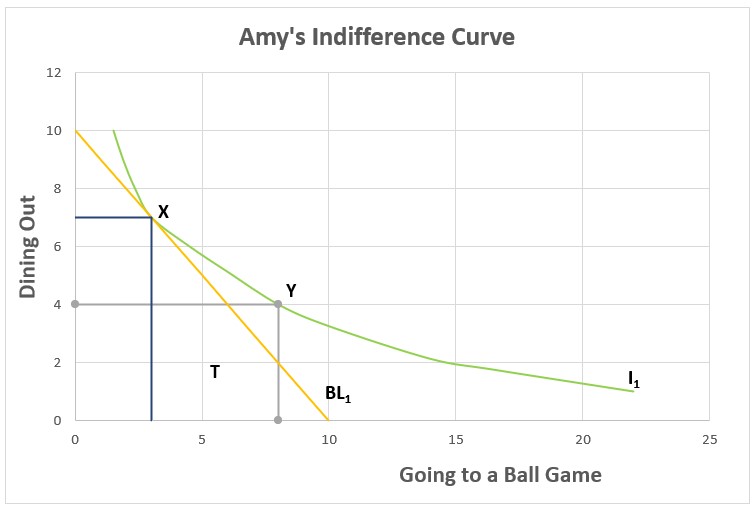
Amy’s income is not large enough to purchase any combination above the budget line, such as eight games and four visits to restaurants (Point Y). She would not choose a point below the budget line because she could increase her utility by purchasing additional items. For example, Amy would not choose T (five games and two visits to restaurants) because she could increase both the times she ate out and the number of ball games she attended while remaining within her budget. Amy would maximize her satisfaction by choosing Point X, the point on her budget constraint tangent to her highest possible indifference curve. She attends three games and dines out seven times. (Note that any point other than X that is on her indifference curve, such as Y, is impossible because it lies above the budget constraint.) However, Amy’s greatest satisfaction would change if the price of either dining out or going to a ball game changed.
Suppose the ticket price of a game is cut in half, but the price of dining out remains the same. How would this alter Amy’s spending behavior? She would likely attend more games, but she may also dine out more because her available income has increased. Her decision will depend on the relative prices and whether the services she purchases are normal or inferior.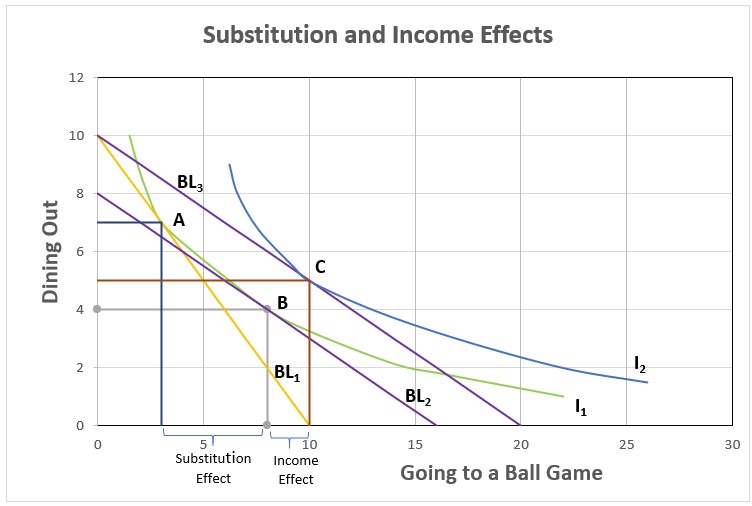
At half the price, Amy could purchase twice as many tickets to ball games and remain within her budget, so her budget constraint line would intersect the x-axis at twenty games. However, the y-intercept remains ten because the number of times she dines out would remain at ten if she chose to spend all her money dining out. Therefore, her new budget constraint line, BL3, would rotate counterclockwise. Assume her new indifference curve is I2. Her greatest satisfaction occurs where her new budget line is tangent to her new indifference curve. Amy would now choose to eat out five times and attend ten games, Point C. How much of the increase in games is caused by the substitution effect, and how much is due to the income effect?
The substitution effect is the difference caused by a change in price, assuming the same level of satisfaction. Therefore, the substitution effect would be derived using the original indifference curve, I1. How many games would Amy have purchased before the increase in income if the price ratio were two games to one time eating out? The answer is eight games and dining out four times. That is determined by drawing a new budget line BL2 parallel to BL3 where it is tangent to the original indifference curve. Point B is the new optimal combination. The substitution effect accounts for five games, the difference between points B and A.
The income effect is the difference caused by a change in income, so it would appear on a different indifference curve. Since Amy’s income increased, the new optimal point would move to a higher indifference curve. This is a two game increase, which is shown as the change from B to C.
Changes in Demand – When Consumer Tastes Change
Demand – The Consumer’s Perspective