Supply-Side Economics
View FREE Lessons!
Definition of Supply-Side Economics:
Supply-side economics is economic policy that focuses on increasing the aggregate supply by providing tax incentives and investment to promote business development.
Detailed Explanation:
Supply-side economists believe that the supply of labor, goods, services, and resources creates demand. Their approach is in sharp contrast with Keynesians who believe demand creates supply. Supply-side policy emphasizes increasing the aggregate supply, while Keynesian policy focuses on increasing the aggregate demand.
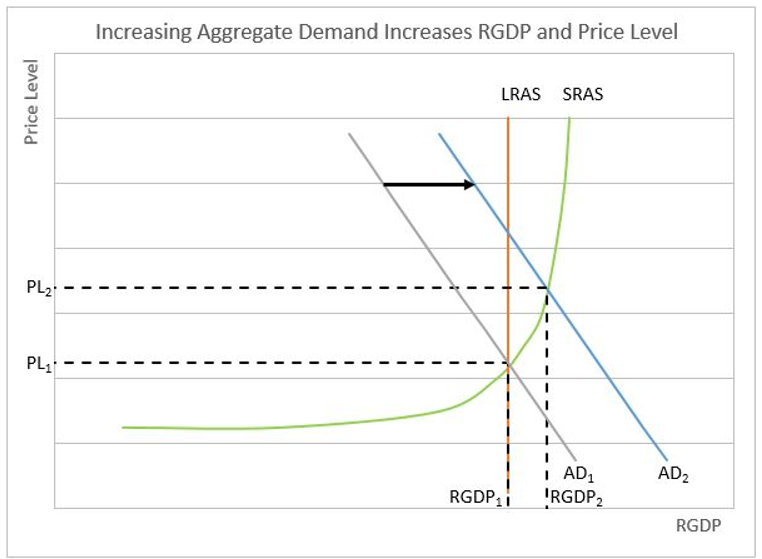
A combination of an increase in the gross domestic product and a decrease in inflationary pressures can
only be accomplished with an increase in the aggregate supply. Increasing the aggregate demand results in economic growth, but at the cost of increasing demand-pull inflation. Graph 1 illustrates how an increase in aggregate demand from AD
1 to AD
2 increases the real gross domestic product (RGDP) from RGDP
1 to RGDP
2, but also increases the price level from PL
1 to PL
2.
Graph 1
Graph 2 shows how an increase in the aggregate supply from AS
1 to AS
2 results in an increase in output from RGDP
1 to RGDP
2, accompanied by a decrease in the price level from PL
1 to PL
2.
Graph 2

When studying these graphs, it is immediately apparent that the aggregate supply curves have different slopes. Keynesians have a short-term view and believe manufacturers can and do, increase their supply when there is an increase in the price level. Supply-siders have a more long-run perspective. In the long run, a country’s income depends on what it can produce, and nothing else. The aggregate supply curve represents an economy’s potential given its limited resources or factors of production. At any given point in time, the aggregate supply curve is vertical because the aggregate supply represents a country’s potential, meaning that the aggregate supply is independent of the price level. So, a more appropriate question is, “What increases an economy’s potential?” Additional labor, the development of resources, and technological advances further an economy’s production capacity and shifts the aggregate supply curve to the right.
Supply-siders concentrate on increasing the aggregate supply using a combination of tax incentives and deregulation. Increasing the aggregate supply results in more people being hired, which increases disposable income and consumer spending. The cycle continues as producers must meet the added demand for their goods and services.
Supply-siders believe high tax rates discourage people from working. Workers may choose to work less overtime. Working spouses may elect to remain at home, particularly if their take-home pay is less than daycare. Older citizens may retire sooner if more of their income is taxed. An extreme case may be where highly compensated individuals choose to move to another country rather than pay high income taxes. This has motivated some wealthy to move to Monaco, the Bahamas, Bermuda, or Panama where there is no income tax. Companies may choose to relocate to countries with lower tax rates. Presently, (February 2017) the US corporate tax rate is higher than most countries, providing an incentive to move operations abroad. (To learn more read the blog,
US Corporate Tax Rates - Are They Too High.)
Economist Arthur Laffer expanded on the relationship between tax rates and people’s willingness to work. He concluded that in 1980 a point had been reached where a reduction in the tax rate would generate an increase in tax revenues for the US government. A graph illustrating this is the Laffer curve.
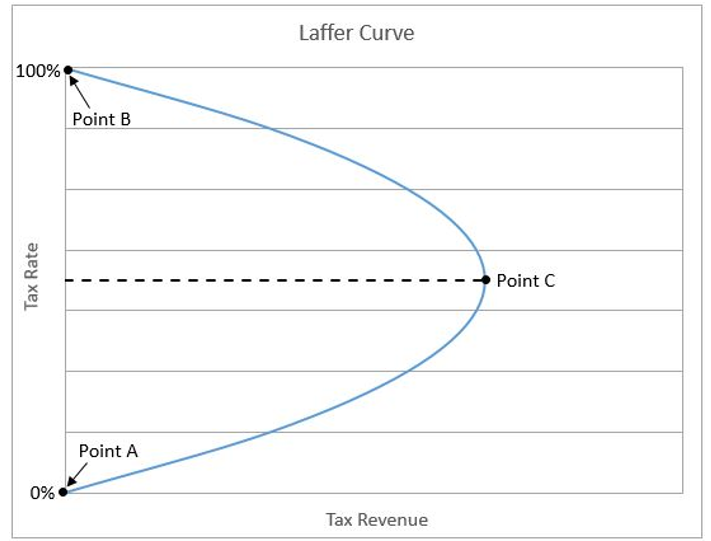
If the tax rate is zero, people would work, but the tax revenue would equal zero. This is Point A on the Laffer curve. At the other extreme, people would not have an incentive to work when the marginal tax rate (the marginal tax rate is the tax rate on the next dollar earned) equals 100 percent because at that point the government would take every additional dollar earned. This is Point B on the Laffer curve. Laffer reasons that people are less willing to work when their marginal tax rate increases. An increase in the tax rate generates an increase in tax revenues at lower rates, but eventually, taxpayers will respond by preferring leisure to work. The number of hours worked would decrease, and a point is reached (Point C) when tax revenues would actually fall following an increase in the marginal tax rate.
When the capital gains tax is decreased, entrepreneurs are more willing to take risks. New technologies are more likely to be developed. Productivity increases. Production costs decrease—which moves the aggregate supply curve to the right.
Most supply-side economists favor reducing government regulation. Adhering to regulations is expensive, and in many cases acts as a barrier to entry. For example, many medical practices have several employees whose job is to sift through insurance claims. Government regulations and red tape detract resources from being used more efficiently. Cutting regulations frees up capital that can be used to produce goods – thereby increasing the aggregate supply.
Finally, supply-side economists generally favor limiting the growth of the money supply. Increasing the money supply does not directly increase production. However, it is inflationary.
The economy was suffering from stagflation when Ronald Reagan became the 40th president of the United States on January 20, 1981. Unemployment was 7.6 percent and rising. Inflation was an even greater concern since it had climbed to 12 percent during the Carter years. Paul Volker had been appointed as the Chairman of the Federal Reserve by President Carter in August 1979. His primary objective was to reduce inflation. By the time President Reagan was inaugurated, inflation had fallen to 8.9 percent, but it was still a concern. Volker continued to pursue a tight monetary policy. Interest rates climbed to record levels. Ronald Reagan was a proponent of supply-side economics and implemented supply-side policies to combat the troubled economy.
In August 1981, President Reagan signed the Economic Recovery Tax Act, the first of two tax bills to reduce federal income taxes. Eventually, the highest personal tax rate was reduced from 70 percent to 28 percent. The corporate tax rate was cut from 46 percent to 40 percent. He encouraged the Federal Reserve to continue its fight against inflation. The tight monetary policy sent interest rates to record levels, but it did lower the inflation rate. When Reagan left office in 1989, the inflation rate had dropped to 4.6 percent. President Reagan also cut regulations in many industries including petroleum, telecommunications, and banking. He cut spending on many government programs, but he also dramatically increased military spending. The combination of lower tax rates and a rise in military spending swelled the national debt from $995 billion to over $2 trillion. Unemployment dropped to 5.3 percent. The economy had recovered. In 1980, the year prior to Reagan's inauguration, the US economy was in a recession. Real economic growth was -0.2 percent. In 1988, Reagan's last year as president, the US economy's real growth rate equaled 4.2 percent. Source:
BEA.
Dig Deeper With These Free Lessons:
Fiscal Policy – Managing an Economy by Taxing and Spending
Monetary Policy – The Power of an Interest Rate
Factors of Production – The Required Inputs of Every Business
Causes of Inflation