Variable Cost
View FREE Lessons!
Definition of Variable Cost:
Variable costs are costs that are directly influenced by how much of a good or service is produced.
Detailed Explanation:
Economists separate business costs into two categories: fixed and variable. Fixed costs are unaffected by output, while variable costs are directly related to output. Examples of variable costs include raw materials, labor directly involved in the production process, packaging costs, sales commissions, and transaction fees. Examples of fixed costs include rent, insurance, salaries of essential personnel, and most overhead expenses. To distinguish between fixed and variable expenses ask, “Will this cost increase if more of a good or service is provided?” If the answer is “Yes”, then the cost is variable.
Some costs have both a fixed and variable component. For example, the utility cost that furnishes power for an office is fixed; but the cost to power machines and equipment to build something is variable. An increase or decrease in production would not have much effect on the electrical power consumption in an office, but the cost to power machinery could change dramatically if a plant went to a second or third shift. In the long run, all costs are variable. For example, insurance is a fixed cost, because the premium is normally not affected by the production level, but an insurance premium may change from one period to the next. In an extreme case, a business may choose to close and eliminate all its fixed costs. Most fixed costs are time-related, such as annual salaries, or monthly rent.
The Fixed and Variable Costs graph below illustrates a business’s cost structure. The orange line represents the company’s total variable costs as output is increased. Variable costs are expressed on a per-unit basis. On the graph it is assumed that the variable cost per unit remains constant, so the total variable cost (TVC) equals the variable cost per unit (VC) times the number of units produced (Q). TVC = VC (Q). The variable cost graph originates at the origin and has a positive slope equal to the variable cost per unit. The blue line represents the company’s fixed costs. The fixed cost curve is horizontal because it is unaffected by output. It intersects the y-axis at the total fixed cost because fixed costs would be incurred even if there is no production (such as when a manufacturing plant closes for a week's vacation) and unchanged if production is nearing its capacity. A company's total cost (represented by the gray line) is the sum of its fixed and variable costs.

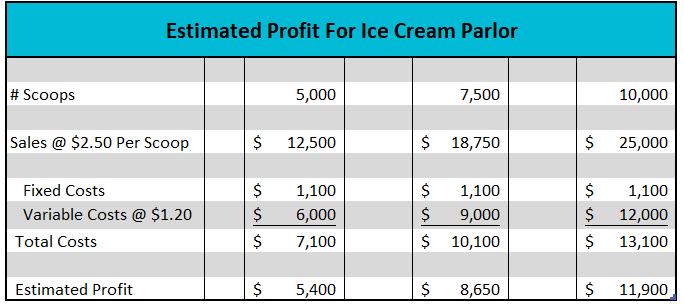
Assume you are considering opening a small ice cream parlor. Understanding your cost structure can help you quickly estimate your profit at different outputs. After doing some research you estimate your total monthly fixed expense would equal $1,100. This includes rent, office utilities, and other overhead expenses. Your variable cost would be approximately $1.20 per scoop. This includes the cost of ice cream, cups, napkins, and labor. You plan to charge an average of $2.50 per scoop. How much would you earn if you sold 5,000, 7,500, or 10,000 scoops in a month? The table below summarizes your estimates. Note that your fixed costs remain constant and your variable costs are directly related to the number of scoops you sell.
How many scoops would you need to sell to cover your fixed costs and variable expenses? In business, this is known as your break-even. Every scoop generates $1.30 in revenues that can be used to pay your fixed costs (Price – VC). If your fixed costs total $1,100, you would need to sell 847 scoops to cover your fixed costs or break even. Once break-even is achieved every sold scoop would add $1.30 to your profit. The break-even formula is:
Break-Even # Units = Fixed Cost / (Price – Variable Unit Cost)
Break-Even # Units = $1,100/ ($2.50-$1.20)
Variable costs have a direct impact on a company’s break-even. If the variable cost increases, more of a good or service would need to be produced to achieve break-even unless there is an increase in the price or reduction in the fixed costs.
Dig Deeper With These Free Lessons:
Output and Profit Maximization
Fundamental Economic Assumptions
Factors of Production – The Required Inputs of Every Business
Marginal Analysis – How Decisions Are Made