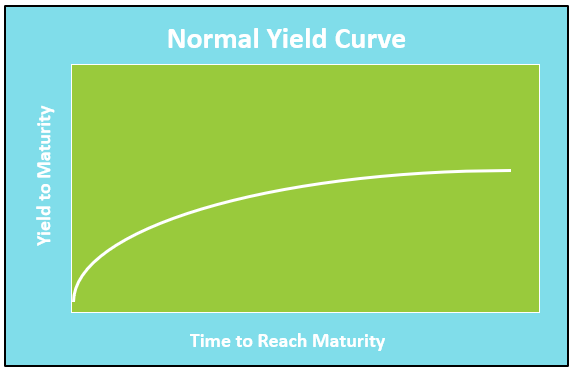
A yield curve is a graph showing the relationship between the yield (interest rates), and how long before a debt or bond matures (paid in full), where the yield to maturity is on the vertical axis and the years to maturity is on the horizontal axis. The comparison must be made between bonds of equal credit quality.
The shape and shifts of the yield curve reveal the market consensus of an economy’s direction. Mortgages, CDs, corporate bonds, and municipal bonds are several securities that have yield curves. However, when investors speak of the yield curve, they are referring to the market for US government Treasuries. The US Department of the Treasury publishes daily yield curve rates.
It is important to consider an investor’s perspective when understanding the yield curve. Suppose you have $10,000 to invest, and you choose to buy US Treasuries. You have several options. You can buy short-term Treasury bills (a maturity of one year or less), medium-term Treasury notes (a maturity between two and 10 years), or long-term treasury bonds (a maturity of 30 years). Keep in mind that if interest rates increase, the value of the investment will decrease. This is truer with longer-term bonds than Treasury bills or notes. (Watch our video Bonds and Interest Rates for an explanation of why bond prices increase when interest rates decrease.) Consider the following scenarios:
The economy is growing. You believe the Federal Open Market Committee (FOMC) will continue to either lower rates or maintain stable rates to encourage continued growth. You have thousands of investment options, but for simplicity, assume there are only the three options listed below.
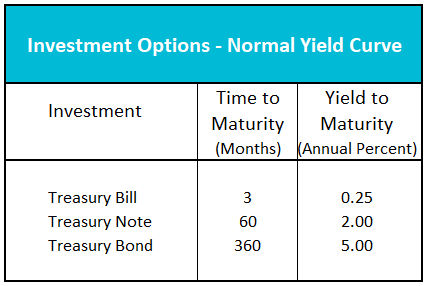
The yields to maturity are expressed as an annual percentage. Which option will you choose? Is the 4.75% difference (commonly referred to as the spread) between in 3-month yield and the 30-year yield worth the risk that interest rates will increase and the value of the 30-year Treasury bond will decrease? You believe it is because if rates remain stable or decrease, you could realize a higher return for your investment. Economists and investors refer to the yield curve as being “normal” when longer-term bonds have a higher return than shorter-term securities.
In our example, the 30-year bond has a higher yield to maturity than the 5-year note and 3-month treasury, so the yield curve is “normal”. Under these circumstances, investors require a higher return when they tie up their money for a longer period because of the added risk associated with time. US Treasuries have little or no risk of default because they’re backed by the federal government, but there is a risk that if interest rates increase the value of a long-term treasury bond will decrease.
Now suppose, the economy is stagnant and crippled by a high rate of inflation. You expect rates will return to lower levels within two years. Your investment options are listed below.

You could earn a ten percent return for a short period by purchasing a 3-month bill, but if you purchased the 30-year bond you could lock into a seven percent return for 30 years. You would also realize a larger capital gain if rates fall, as you expect them to do.
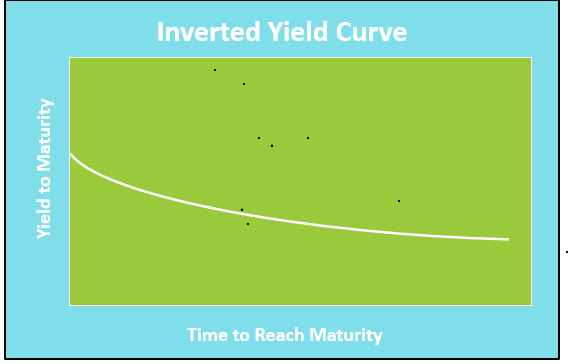
The yield curve is inverted when short-term yields are higher than long-term yields. Inverted yield curves are most common prior to a recession. As the economy approaches its peak, inflation increases. The monthly increases in consumer and business spending become less. As the economy slows, the demand for credit decreases, and banks must lower their longer-term rates to attract borrowers. In addition, the Federal Reserve may begin to increase short-term interest rates to slow an overheated economy and control inflation. Investors seeking higher returns for longer periods may choose to lock in higher returns by purchasing longer-term bonds even though the short-term rates are higher.
Economists and investors try to interpret changes in the yield curve’s slope because it provides insights into macroeconomic trends. A steeper positively sloped yield curve normally predicts an escalating price level. Inflation reduces the real value of future payments so investors demand a higher return on long-term securities when they believe inflation will increase. Many investors may park their money in short-term debt and wait for interest rates to rise. This action reduces short-term rates. This is common in an expansion.
A yield curve will flatten when inflation fears diminish. A curve may also flatten if the Federal Reserve increases short-term interest rates to slow the economy when there is a normal yield curve. A flat yield curve is indicative of periods when there is little or no spread between short-term and long-term rates. Investors do not demand the added return caused by an added risk and inflation.
When a yield curve inverts, it is usually a sign of a coming recession. Normally, interest rates decrease as economic growth slows. Investors purchase longer-term bonds to lock in yields before they fall. The increased demand for long-term bonds pushes up their price, which reduces their yield. This is compounded if investors are selling short-term securities to generate the cash needed to purchase the bonds.
Business Cycles
Monetary Policy – The Power of an Interest Rate
Capital – Financing Business Growth