State of The Economy - April 2019
During the first quarter of 2019, the United States economy grew 3.2%, which is remarkable given the economy is nearly a decade into its most recent expansion. Employment is strong and workers continue to be added to payrolls. Inflation has been so tame that the Federal Reserve chose to discontinue its policy of tightening. Yet, as always, there are a few concerns. Review my summary of these important government reports and read my analysis at the end of this blog.
Real Gross Domestic Product (RGDP)
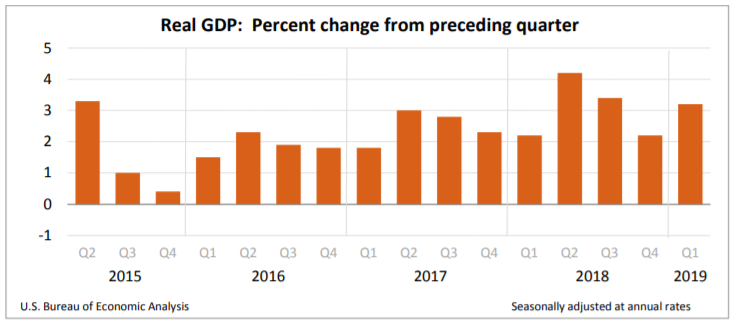
On April 26th, the Commerce Department estimated the US economy grew 3.2% in the first quarter of 2019. The BEA will revise this figure when it publishes its revision on May 30th. The highlights are below, or readers can access the report at
Bureau of Economic Analysis (BEA).
- The US economy grew at an annual clip of 3.2% in the first quarter. This up from 2.2% in the fourth quarter of 2018. It is also the largest first quarter gain in four years.
- The PCE price index increased 0.6% in the first quarter, which is down from 1.5% in the last quarter. The core PCE price index, which excludes food and energy, increased 1.3% compared to 1.8% in the last quarter of 2018. The PCE price index is the inflation measure preferred by the Federal Reserve when deciding its monetary policy.
- Growth in real disposable personal income slowed from a rate of 4.3% last quarter to 2.4% in the first quarter of 2019.
Personal Income and Outlays
Personal consumption expenditures (PCE), more commonly referred to as consumer spending, comprises approximately 66% of economic activity in the United States. (Read our lesson
Gross Domestic Product - Measuring an Economy's Performance to learn more about the importance of PCE.) Over an extended period, consumer spending is directly tied to household income. Watching the economy's trends in income and expenses provides an important measure of the economy’s health. The Commerce Department released
Personal Income and Outlays, March 2019 yesterday. Here are the highlights.
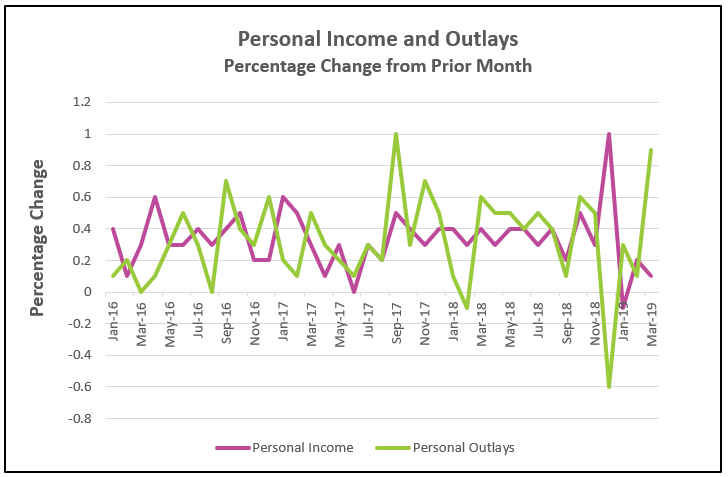
- Consumer spending surged 0.9% in March, the largest gain since August 2009. This follows increases of 0.3% in January and 0.1% in February.
- Personal income increased 0.1% in March, following a 0.2% increase in February and a 0.1% decrease in January.
- After-tax income did not keep pace with inflation in March. Real disposable income, or the income after inflation and taxes, fell 0.2% in March, following a flat February and another decrease of 0.2% in January.
- During March, prices as measured by the PCE price index, increased 0.2%, following a 0.1% increase every month since November 2018. For the prior 12 months the PCE price index rose 1.5%. This is higher than January and February, but the PCE price index remains lower than at the end of 2018.
- The core inflation index was unchanged in March and increased 1.6% over the prior 12 months.
- The personal savings rate fell from 7.3% in February to 6.5% in March. This is not surprising given the small increase in income and the large increase in consumer spending.
Consumer Price Index
The
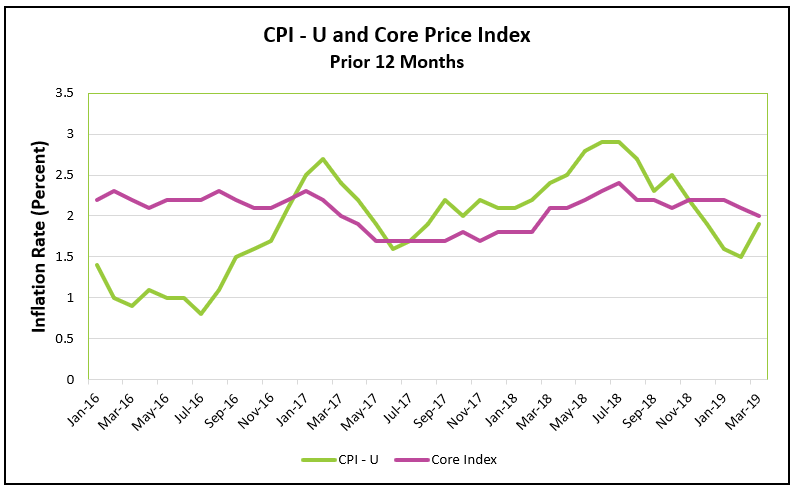
consumer price index climbed 0.4% in March, the most since January 2018. Don't be alarmed because all indications are that inflation remains relatively tame. Over the prior 12 months the CPI has increased 1.9%. The Bureau of Labor Statistics published
Consumer Price Index - March 2019 on April 10th. The data are consistent with another measure of inflation, the PCE price index, which was released yesterday and discussed in the preceding paragraph. Here are the highlights of the BLS report.
- Higher food and energy costs are beginning to fuel inflation. March’s inflation was the largest since January 2018. It doubled from 0.2% to 0.4%. Over the prior twelve months the CPI increased 1.9%, which is up from 1.5% in February.
- The core index, which does not include food and energy prices, rose 0.1% in March, the same as in February. Over the prior 12 months the index increased 2.0%, which is a small decrease from 2.1% in the 12 months prior to February.
- Higher energy prices accounted for 60% of the difference between March’s core and CPI indexes. Energy prices increased 3.5% in March alone. Gasoline was the greatest contributor, rising 6.5%. However, gas prices remained 0.7% lower than they were 12 months before.
- Food prices have been creeping up. As a group they increased 2.1% over the prior 12 months and 0.3% in March.
Employment
The employment report remained very encouraging. The number of workers added to payrolls jumped from 33,000 in February to 196,000 in March. This compares to an average monthly increase of 223,000 workers in 2018. Most of the other vital figures remained little changed in March. Read the report by visiting
The Employment Situation – March 2019. Here are the highlights.
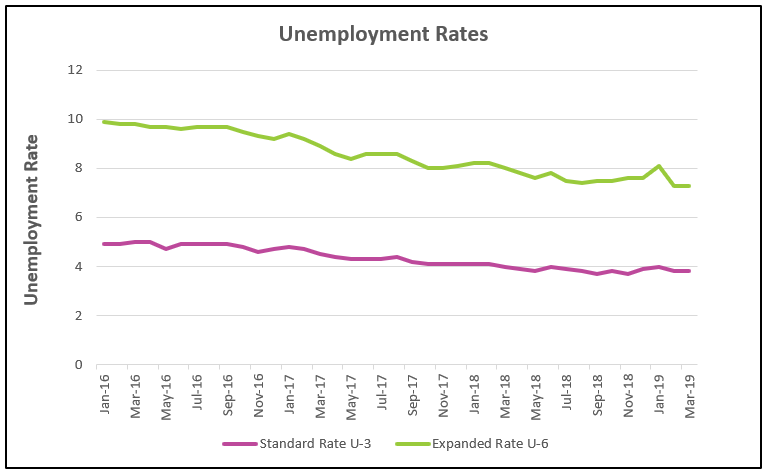
- The standard unemployment rate was unchanged at 3.8% since last month’s report. (Watch our video to learn about the different types of unemployment.)
- 196,000 workers were added to payrolls in March.
- The average workweek increased 0.1 hours to 34.5 hours. Hourly wages for all workers increased an average of $0.4 to $27.70. Wages have increased 3.2% over the prior 12 months.
- U-6, the broader measure of unemployment also remained unchanged at 7.3%.
Summary and Analysis
Today and Wednesday, April 30th and May 1st, the Federal Reserve Open Market Committee will meet to discuss monetary policy. This will be their first meeting since Chairman Powell announced the Committee would discontinue their schedule of increasing the federal funds rate and to allow the economic data to dictate future policy. The economy grew 3.2% in the first quarter. Consumer spending increased 1.9% in March. Are these figures enough justify altering the Fed’s policy? Absolutely not…While these increases have been greater than expected, the numbers require closer scrutiny before reaching that conclusion.
Consumer spending drives the economy and jumped at an annual rate of 1.9% in March. However, the quarterly figure was less favorable. Consumer spending increased at an annual rate of 1.2% during the first quarter, the smallest increase since a year ago. The larger than expected March increase was partially due to a pent-up demand during the beginning of the quarter. Perhaps consumers and businesses were more cautious in their spending during the partial government shutdown in late 2018 and early 2019.
During the first quarter disposable personal income increased 2.4%, after being adjusted for inflation. That was less than any quarterly gain in 2018. In March, real personal disposable income fell 0.2%, which means after-tax personal income did not keep pace with inflation.
So, if consumer spending was not as robust in the first quarter as initially thought, then how did the economy manage to grow 3.2% in the first quarter? There were abnormally favorable trends in inventories and exports that exaggerated the health of the economy in March. Inventories were the greatest since 2015. Large inventories can deter future growth if they are not combined with an increase in consumer spending because inventories increase when companies fail to sell as much as they expect. Fortunately, retail sales improved since the first two months of the year. In March retail sales rose to their highest level since September 2017. The private inventory adjustment added 0.65% to the increase in RGDP. A smaller than normal trade deficit also contributed to the higher than expected growth. If inventories and the trade deficits return to normal levels, it could slow growth in RGDP in the second quarter.
Inflation remains well within the
FOMC’s goals. The prior 12-month core PCE price index (the measure favored by the FOMC) was lower at the end of March when it equaled 1.6%, than it was in November 2018 when it equaled 1.8%. But, expect the overall inflation rate to increase in the next few months. Energy and food prices have begun to gain momentum. Energy prices fell for much of the last quarter and early 2019 – but they began to increase sharply in February. Likewise, food prices have climbed at a faster clip than the overall inflation rate since November 2018. These increases explain why the core indexes, which exclude food and energy prices, has increased more than the standard inflation rates. These increases will impact the demand for other products because consumers will be spending a larger portion of their incomes on food and energy.
Trade needs to improve. The US economy is tied to world economies and at some point the US economy would be adversely impacted if the major world economies continue to struggle, even if the current trade disputes are resolved. Improvements in the European and Chinese economies would increase the demand for US goods. Hopefully the new measures taken by the European Central Bank will help. It announced a new stimulus package in early March because the European economies have an anemic growth. It plans to hold interest rates at subzero and provide low long-term rates to several banks. Recently the European Central Bank lowered its expected growth rate from 1.7% to 1.1% according to The Wall Street Journal article,
ECB to Launch New Stimulus in Major Policy Reversal. (Published March 8, 2019) China’s growth has also slowed.
Many of the economic gauges were disappointing in the first quarter, but normally the first quarter figures are weaker, and the economy showed signs of improvement in March. The large gains in spending should fuel improved sentiment and continued buying. For the economy to remain strong, monthly gains in consumer spending need to equal or exceed 0.4%, as it did in most of 2017 and 2018. Eventually trade disputes will be resolved. International economies will prosper, which should be an added stimulus to the US economy.