The April reports are in. The pace of the economy has slowed, but it continues to grow, largely because of a minimal increase in consumer spending. The unemployment rate again dropped, and remains near the full-employment rate. Many economists are puzzled why wages have not increased more. Normally a tightening labor market results in upward pressure on wages. Some explanations include a reduction in productivity and a large pool of the underemployed. The underemployment rate remains stubbornly high at 8.6 percent.
Please note we have tried to use the most updated information in our graphs, but these figures are constantly revised. Links to the sources have been provided so readers can secure the most up to date figures.
Gross Domestic Product
The
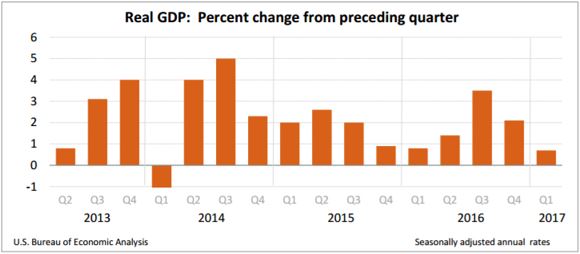
BEA released its first gross domestic product estimate for 2017. The seasonally adjusted
real gross domestic product (RGDP) grew at 0.7 percent, down from a 2.1 percent pace in the fourth quarter of 2016, and a 3.5 percent increase in the third quarter of 2016. This is the slowest growth since the mild contraction of negative 1.2 percent in the first quarter of 2014. The main reasons for the low rate of growth include weaker than expected consumer spending, reductions in private inventory investment, state and local government investment, federal government investment, and an increase in imports. The bad news was partially offset by an increase in exports and residential spending. For the full report read
BEA - April.
However, the slow growth could also be partially explained because the seasonal adjustments do not provide an accurate picture of the first quarter. Note on the graph below that growth in the first quarter appears abnormally low in several years. Many economists believe the figures are not a true reflection of the first quarter's growth and call the difference "residual seasonality". The BEA describes residual seasonality as "when seasonal patterns remain in data even after they are adjusted for seasonal variations." The BEA is researching the issue. Tim Duy in
Bloomberg View on May 8, 2017 wrote about the challenge in interpreting the May GDP figure and his opinion that the Federal Reserve needs to discount the report.
To learn more about how the GDP and RGDP are calculated visit our free lesson
GDP – Measuring an Economy's Performance.
Personal Income and Outlays
Personal income increased 0.2 percent in March. Government benefits, such as Social Security and Medicare, increased 0.23 percent and accounted for most of the increase. Wages and salaries increased less than 0.1 percent, indicating weakness in the labor market continues to be a concern. Personal expenditures remained unchanged since January, which is consistent with the GDP figures which showed weakness in consumer spending.
BEA Personal Income and Outlays – March 2017 is the original report.
The graph below illustrates recent trends in personal and disposable income and consumption.
Inflation
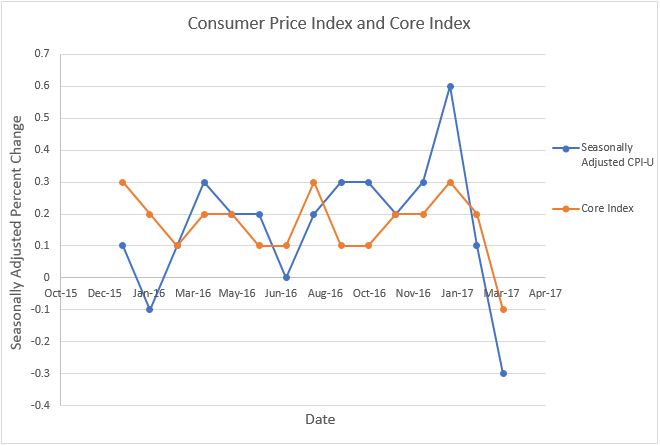
Gasoline prices declined 6.2 percent in March, more than offsetting increases in food prices. Overall the
consumer price index (CPI) fell 0.3 percent. This is the first decrease since February 2016. As expected the
core price index, which does not include energy and food costs, was less volatile. However, it also decreased, but only by 0.1 percent. This was the first decrease since January 2010. Wireless communication, new and used vehicles, and clothing were the largest contributors to the decrease. Over the past 12 months, inflation has been 2.4 percent and the core index has increased 2.0 percent. (See graph below.) Economists favor the core index when analyzing inflation because it negates the volatile fluctuations in the energy and food markets. For example, using only March's CPI may have led to the wrong conclusion that the economy was showing alarming signs of slowing down because of the large drop in the price level. However, using the core index would provide a more realistic story that the economy is quite stable, and there is little reason to be alarmed by the sudden change in the CPI.
To read the full report released April 14th visit
Bureau of Labor Statistics - Inflation. To learn more about inflation we encourage you to visit our free lessons
Inflation and
Causes of Inflation.
Source:
Bureau of Labor Statistics
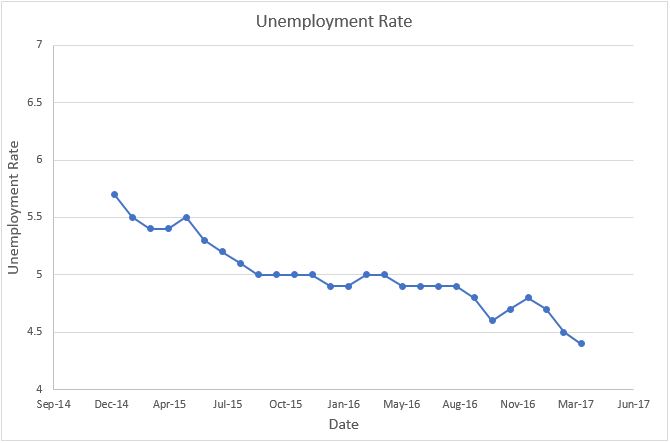
Employment
The unemployment rate dipped slightly from 4.5 percent to 4.4 percent.
Unemployment continues to decline and there is evidence of a tightening labor market which should lead to higher wages (and higher inflationary pressures). 211,000 workers were added to payrolls. Workers in leisure, hospitality, and health care benefited the most. The average work week has edged upward 0.1 hour to 34.4 hours. Furthermore, the average hourly wage increased $.07 to $26.19. This is an annual increase of 2.5 percent. However, with inflation at 2.4 percent,
real wages have only increased 0.1 percent.
Read the original publication at
BLS – Employment Situation.