State of the US Economy - July 2017
The economic reports for July are in, and there were no big surprises. The US economy continues to grow, inflation remains low, and employment is rising. Stock markets continue to hit record highs fueled by positive corporate earnings.
Real Gross Domestic Product
The economy has entered its ninth straight year of growth according to the
National Bureau of Economic Research. Our current expansion started in June 2019. Only the expansions between 1961 and 1969 and 1991 and 2001 have been longer. To learn more visit our free lesson
Business Cycles.
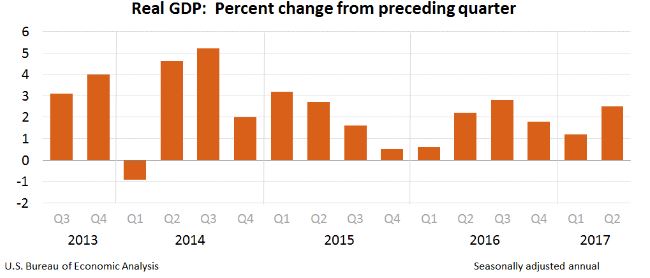
The United States'
real gross domestic product (RGDP) more than doubled between the first and second quarters of 2017. RGDP is the most common measure of the size of an economy. Growth in the first quarter was revised downward from 1.4% to 1.2%. The BEA's advance estimate of growth in the second quarter is 2.6%, which was expected by most economists. In recent years the second quarter growth rate has been significantly higher than the first quarter. Many economists believe the first quarter figures are not a true reflection of the first quarter's growth and call the difference "residual seasonality", which means the seasonal adjustments do not provide an accurate picture of the first quarter.
The economy grew approximately 1.7% in the first half of 2017. Once again, consumers helped propel the growth. Consumer spending, which accounts for approximately 69% of real gross domestic product, (RGDP) increased 2.8%, up from 1.9% in the first quarter. Many economists wonder how long the strength in consumer spending will last without significant increases in wages.
Business investment jumped 5.9%. This is encouraging because it indicates that most businesses forsee growth continuing. Another encouraging sign is the improvement in trade. The trade deficit has improved largely because of an increase in exports.
On the down side, residential investment fell 6.8% following an 11.1% increase last quarter.
Source:
Bureau of Economic Analysis
Personal Income and Outlays
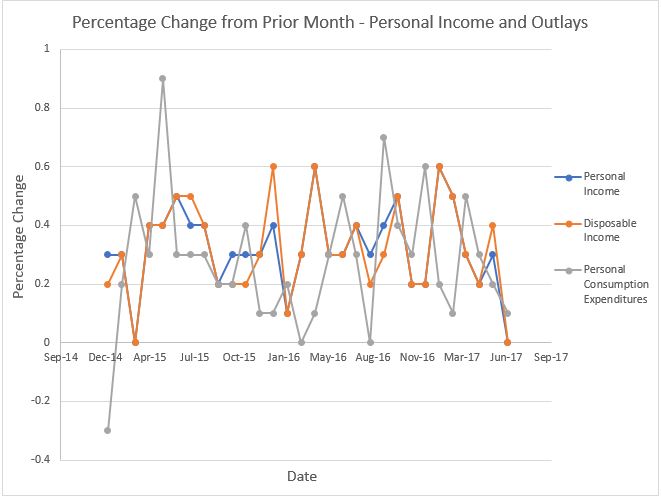
The
BEA Personal Income and Outlays report is used to monitor household income and spending. An increase in household income is normally a good indicator of future growth. Spending without income ultimately requires consumers to dip into savings or borrow – both can be signs of a weaker economy. In June, consumer income was unchanged and spending increased slightly (0.1%).
The Personal Consumption Expenditures (PCE) price indexes are also included in this report. The PCE is favored by the Federal Reserve making it the more important index when evaluating monetary policy. However, most contracts that are tied to inflation use the
consumer price index. Unlike the consumer price index, the PCE accounts for changes in spending behavior as the price of a good increases or decreases. For example, the weight given to chicken would increase if consumers substitute chicken for beef following an increase in the price of beef. The consumer price index assumes the items in the basket are unchanged. The core index, which excludes food and energy, remained unchanged at 1.5% and below the Federal Reserve's target of 2.0%. When inflation is too low it may be a sign that the economy is not as healthy as some of the growth figures indicate. Normally a growing economy adds pressure to wages, which in turn increases inflation. The
Federal Open Market Committee would like to see an increase in wages. The low inflation rate creates uncertainty which may delay the FOMC's decision to raise the
federal funds rate later this year.
Source:
BEA
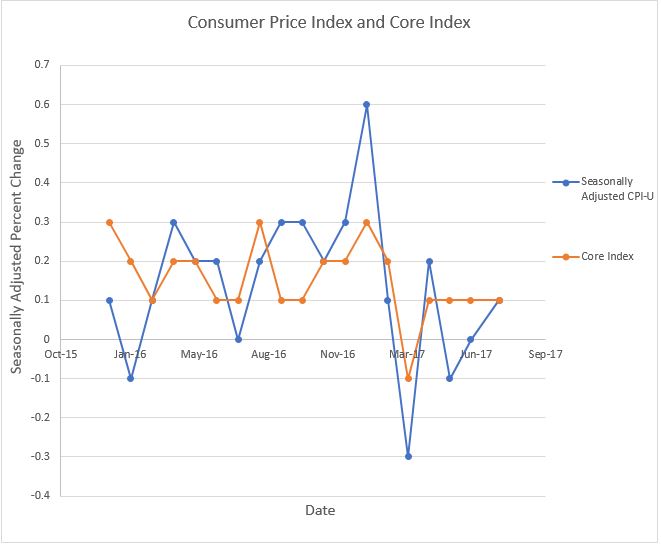
Inflation – Consumer Price Index
The consumer price index is the most widely used measure of inflation. On August 11th, the
Bureau of Labor Statistics reported that the CPI index increased 0.1% in July, and 1.7% over the past 12 months. The summer is beginning to treat the airlines well. Airline fares soared 0.7% following several months of decreases. Offsetting that is a record 4.2% decrease in the price of lodging. Meat prices continue to rise in response to an increasing demand. In July, prices increased 0.7% following increases of 0.3% in May, and 0.6% in June. Car buyers benefited from lower prices in July. Sales were lower and dealerships cut their prices an average of 0.5%. The volatility of energy and food prices is the main reason economists view the
core index as a more reliable measure of inflation. The core index rose 0.1 percent in July and has increased 1.7 percent over the past 12 months. To learn more about inflation we encourage you to visit our free lessons
Inflation and
Causes of Inflation.
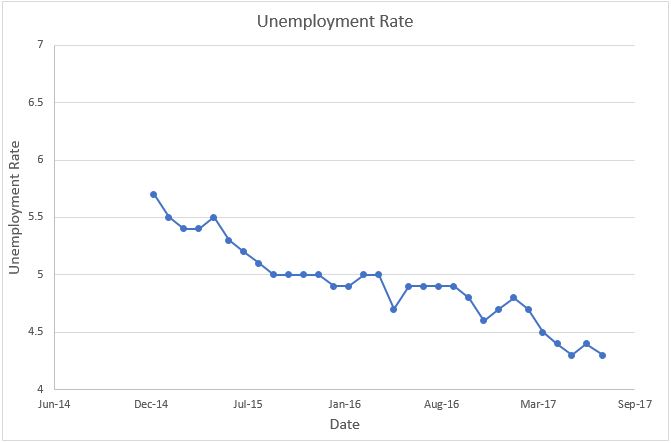
Employment
The Bureau of Labor Statistics reported earlier this month that 209,000 jobs were added to the economy and the unemployment rate (4.3%) decreased slightly in July. The sectors with the largest gains included food and beverage (53,000), professional and business services (49,000) and health care (39,000).
An individual must be actively seeking and unable to find work to be considered
unemployed. The participation rate also increased slightly because people who had previously been discouraged entered the labor pool. For the second month in a row, the participation rate inched up 0.1 percent to 62.9 percent. The participation rate is the percentage of the total population age 16 or older who are either employed or seeking employment.
Since January, employment has been relatively stable. The average hourly wage increased 9 cents in July to $26.36 per hour. This is a gain of 2.5% in the last 12 months. The unemployment rate continues to be below what most economists consider the full-employment rate of approximately 5 percent. Janet Yellen, the Chairperson of the Federal Reserve, and most economists predict that shortages of qualified workers should continue to push wages higher.
Source:
BLS