State of the Economy - October 2017
Improvements in the U.S. economy have boosted consumer confidence to a 17 year high. The Conference Board released its
Consumer Confidence Survey on November 29th. Economic growth exceeds 3% per quarter. Unemployment has fallen to its lowest level since 2000. Personal incomes are increasing. Inflation remains low. But economists are beginning to see signs we are nearing the end of the economy’s record expansion. Labor markets are getting tighter. This quarter the economy passed the Congressional Budget Office’s estimate of sustainable growth. When this occurs, companies begin to have trouble hiring and retaining their employees. It is likely the Fed leaders will increase the
federal funds rate for a third time this year when it meets in December.
Real Gross Domestic Product
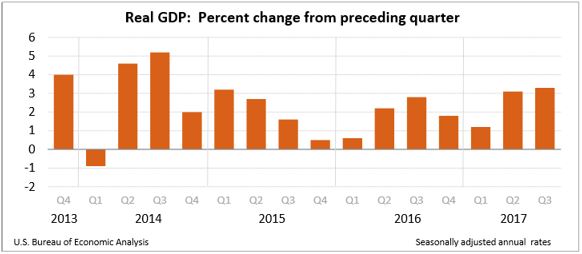
Economic growth has accelerated in each of the first three quarters of 2017. In the third quarter, the US economy’s
gross domestic product (GDP) increased 5.5%, to over $19 trillion. When adjusting for inflation, the US economy grew at 3.3% during the third quarter, according to the revised estimate released November 29th by the
Bureau of Economic Analysis (BEA). This is up sharply from the first quarter, when the economy grew at 1.2%, and slightly over the 3.1% growth in the second quarter.
Private investment in equipment jumped 10.4%, which indicates businesses anticipate growth in the fourth quarter and must improve their productivity and increase their capacity. Personal consumption, which accounts for over 60% of the US economy also continued to show strength, although not as much as in the second quarter. Consumers spent 2.3% more in the third quarter. (Private consumption increased 3.3% in the second quarter.)
The economy has grown nine years according to the
National Bureau of Economic Research. Only the 1961 - 1969 and 1991 - 2001 expansions have been longer. Growth exceeded 3.0% several times during Mr. Obama’s presidency, but failed to sustain the momentum. The last time the
real gross domestic product (RGDP) increase exceeded 3% was in the first quarter of 2015, when the economy grew at 3.2%. Most economists do not believe the current growth rate is sustainable, and their belief is supported by the
Congressional Budget Office, which estimates 2017’s potential or sustainable output at $17,093 billion (2009 dollars). (
CBO Sustainability) RGDP in the third quarter equaled $17,170.
Corporate profits rose sharply from the second quarter. ($91.6 billion, compared to $14.4 in the second quarter) Domestic financial companies showed the greatest gain. Higher profits have contributed to the stocks appreciating to record highs. Read the BEA’s full report at
Gross Domestic Product.
Visit our free lesson,
Gross Domestic Product – Measuring an Economy’s Performance, if you would like to learn more about the GDP.
Personal Income and Outlays
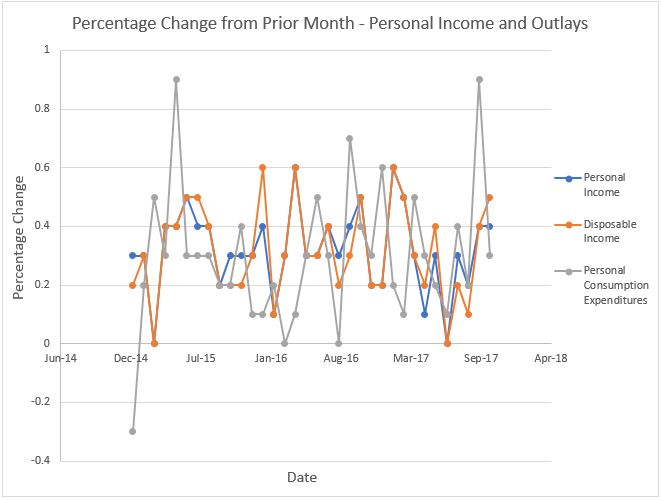
Personal income has continued to increase. It rose 0.4% in October. This is encouraging since personal income has lagged behind the rest of the economy during most of the year. More importantly, disposable income increased 0.5%, which means consumers have more to spend each month.
In October, personal consumption expenditures did not maintain its torrid pace set in September, where it increased 0.9%, but it did grow 0.3%. September’s unusually large spending increase was attributable to people replacing and repairing items that were devastated by Hurricanes Harvey and Irma. For example, automobile sales jumped 8.8% in September.
The personal consumption expenditures price indexes for October are also included in this report. The PCE price index is favored by the Federal Reserve, making it more important than the more commonly used consumer price index when evaluating
monetary policy. The core index, which excludes food and energy, equaled 1.4% for the prior twelve months and 0.2% for the month. The Federal Reserve’s target is 2%. The monthly figure, when annualized equals 2.4%. Normally a growing economy adds pressure to wages, which in turn increases inflation. The
Federal Open Market Committee would like to see a continued increase in wages. The recent uptick in the inflation figures increases the likelihood the FOMC will raise the
federal funds rate when it meets December 12th and 13th.
Most contracts that are tied to inflation use the
consumer price index. Unlike the consumer price index, the PCE price index accounts for changes in spending behavior as the price of a good increases or decreases. For example, the weight given to chicken would increase if consumers substitute chicken for beef following an increase in the price of beef. The consumer price index compares items in a “basket” of commonly used goods and services. The measure assumes no change in the basket contents.
The personal savings rate increased from 3.0% to 3.2%.
Read the Bureau of Economic Analysis’s
October Personal Income and Outlays report.
Consumer Price Index
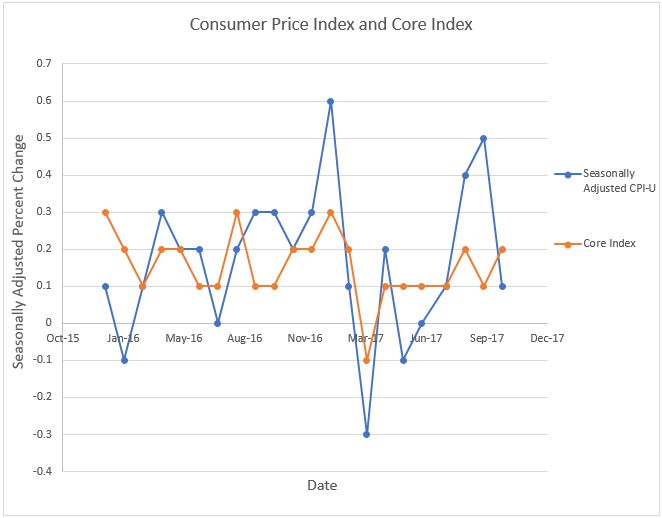
The Bureau of Labor Statistics reported that prices increased 2.0% over the last 12 months. This is down from 2.2% in September. The rate of increase in the consumer price index fell from 0.5% in September to 0.1% in October. Are inflationary pressures easing? No. The core index increased from 0.1% in September to 0.2% in October. The volatility of energy prices explains the sharp rise in September and the slowdown in October. Gasoline prices increased 13.1% in September and fell 2.4% in October. Most of the movement can be explained by the disruptions in supply caused by Hurricane Harvey. The price spiked in September following the shut-down of eight refineries and decreased when the refineries reopened. The large fluctuation illustrates why most economists view the core inflation rate as more reliable when gauging long-term trends. The
core price index measures the inflation rate of all items except food and energy.
On November 14th, the Bureau of Labor Statistics reported that the
producer price index (PPI) increased 0.4% in October, and 2.8% over the past 12 months. Changes in the PPI frequently signal changes in the consumer price index. Retailers may try to pass some of their cost increases (which is measured in the PPI) through to the final buyer (which is measured in the CPI). The producer price index (PPI) measures inflation for suppliers. It is the weighted average cost of a basket of goods and services sold in the wholesale, manufacturing, and commodity markets.
Read the Bureau of Labor Statistics
Consumer Price Index report.
Employment
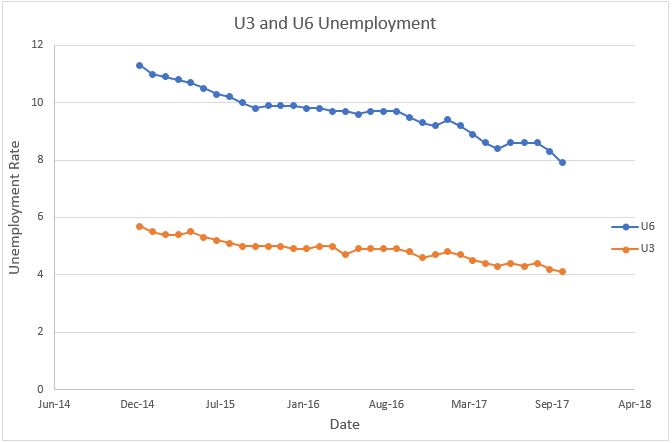
Unemployment continues to fall. In October the seasonally adjusted unemployment rate dropped 0.1% from September to 4.1%. (The unadjusted unemployment rate is 3.9%.) Over the past twelve months the rate has fallen 0.7%. Other employment figures have also improved. Underemployment dropped from 8.3% to 7.9%, indicating that people who had settled for a part-time position or a job that is beneath their skill level are now being hired in preferable jobs. The largest gain was in food and beverage. Many workers were rehired because they had lost their jobs following the hurricanes in September.
In October, the average hourly earnings equaled $26.53 which is $.01 less than September, but that is following an increase of $0.12 in September and $0.63 over the prior 12 months. It is likely that the hurricanes affected September’s and October’s changes. The hurricanes forced many restaurants to close, leaving many employees without work. Restaurant employees are also some of the lowest paid, so the average hourly earnings was pushed up when they lost their jobs in September. Earnings figures returned to “normal” when those workers were rehired in October. Hourly wages have gained 2.4% over the last twelve months, which exceeds the inflation rate, so the trend is for higher wages.
The unemployment rate continues to be below what most economists consider the full-employment rate of approximately 5 percent. Most economists predict that shortages of qualified workers should continue to push wages higher.
Are you interested in learning the unemployment rate in your area or in a region you are interested in moving to? If so, then open the link to the Bureau of Labor Statistics -
Metropolitan Area Employment and Unemployment report. Ames, IA had the lowest unemployment rate of 1.4%. El Centro, CA suffered 20.9% unemployment, the highest in the nation.
Read the Bureau of Labor Statistics
Employment Situation Summary.
National Debt
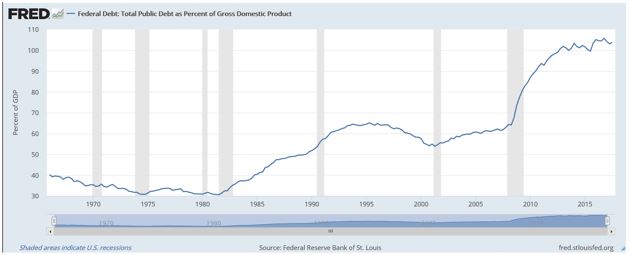
The US national debt now exceeds the nation’s gross domestic product by 3.8%. This is up 0.7% from the second quarter. What does this mean? The best measurement for a debt’s affordability, whether it is a family purchasing a new home or a country, is the relationship between debt and income. The upward trend in the ratio is becoming more alarming, particularly when it increases during an economic expansion. Hopefully Congress will consider this trend when constructing its budget next month for the new fiscal year.
Source:
Federal Reserve Bank of St. Louis