
In October 2021, the state of the United States economy is improving. Payrolls continued to rise as companies increased wages to attract and retain workers. Households are flush with cash and continue to spend. All these factors have contributed to increasing the aggregate demand. But companies are struggling to meet their demand. The imbalance between the economy’s aggregate demand and its aggregate supply has pushed up prices to an alarming level. To learn more about the US economy’s progress and where it is heading, read our summary of vital statistics and analysis.
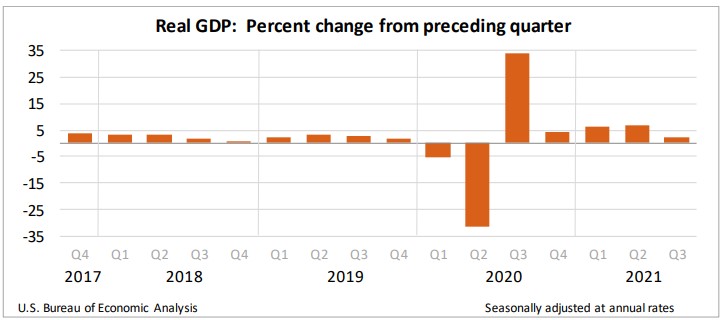
The economy was growing at a swift pace when it entered the third quarter of 2021. In July, employers added 943,000 people to their payrolls. But in August, payrolls increased by only 235,000. A resurging number of COVID-19 cases and supply bottlenecks slowed economic growth. Consumers continued to spend but at a much slower clip. They did not dine out or travel as much in the later months. Spending on durable goods, particularly automobiles, fell sharply. (Motor vehicle output fell 42%.) Supply chain challenges, including distribution bottlenecks and a shortage of workers and materials, prevented businesses from keeping pace with their demand. Also contributing to a slower growth rate was the cutback of fiscal stimuli such as supplemental unemployment insurance. Businesses slowed their investment in structures and equipment but invested heavily in intellectual property. Residential investment fell for the second straight quarter because labor and supply shortages hampered builders. However, most economists believe that in the fourth quarter, fewer COVID cases and increased consumer sentiment will reverse the slowing trend in the third quarter.
Prices increased at an unacceptable pace. Businesses are faced with escalating costs, such as labor, parts, and shipping. They are trying to recover some of their added expenses by increasing their prices. Readers can access the full report at Gross Domestic Product, Advance Estimate Third Quarter 2021. The BEA will release its second estimate of RGDP on November 24th.
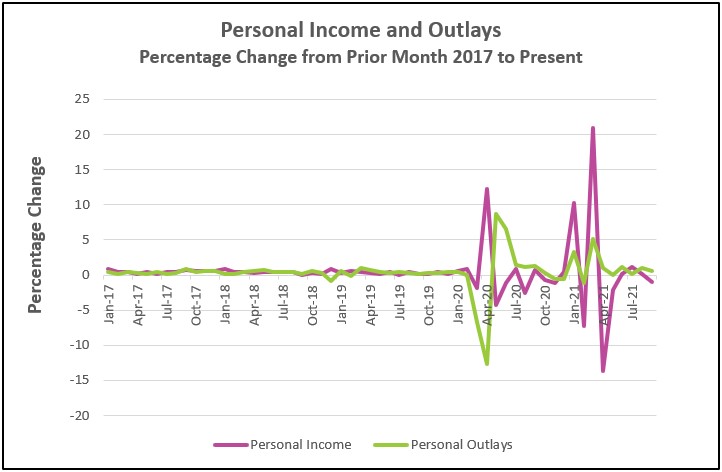
The Delta variant of COVID-19 continued to discourage people from venturing out and held back consumer spending. Spending rose only 6.9% during the third quarter compared to 19.3% in the second quarter. In September, consumers spent more on services (up 0.6%) and nondurable goods (up 0.9%.). Shortages in automobiles contributed to a fall in spending for durable goods (down 0.2%). Meanwhile, escalating inflation diminished consumer spending power. Prices increased at the fastest clip since 1991 when measured by the Federal Reserve’s preferred index. Household income fell in September, mainly because many of the government assistance programs expired. However, an increase in wages and salaries is indicative of an improving economy. Read the full report Personal Income and Outlays – September 2021. The highlights are listed below.
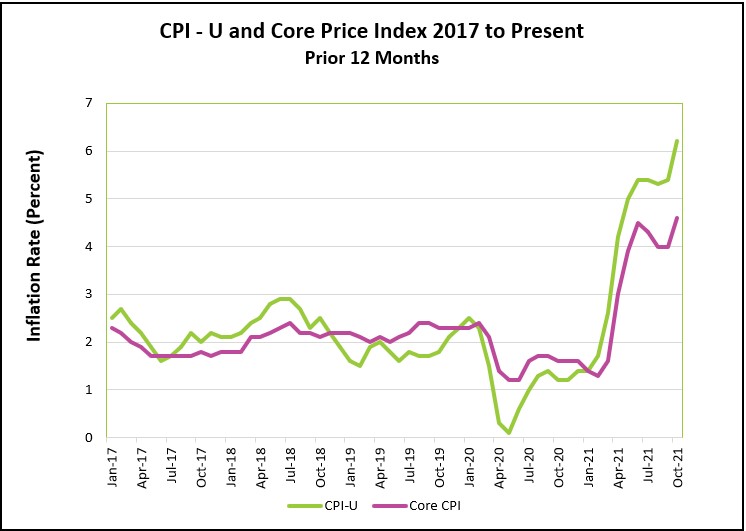
The inability of companies to increase their supply to meet an increasing demand has pushed inflation rates to the highest they have been in three decades. Many economists, including those at the Federal Reserve, believed these price increases would dissipate when the supply-chain issues and growing demand would return to normal. They did, temporarily. Inflation softened in July and August but escalated again in September and October. Read the Bureau of Labor Statistics’ release Consumer Price Index – October 2021. The report’s highlights are summarized below.
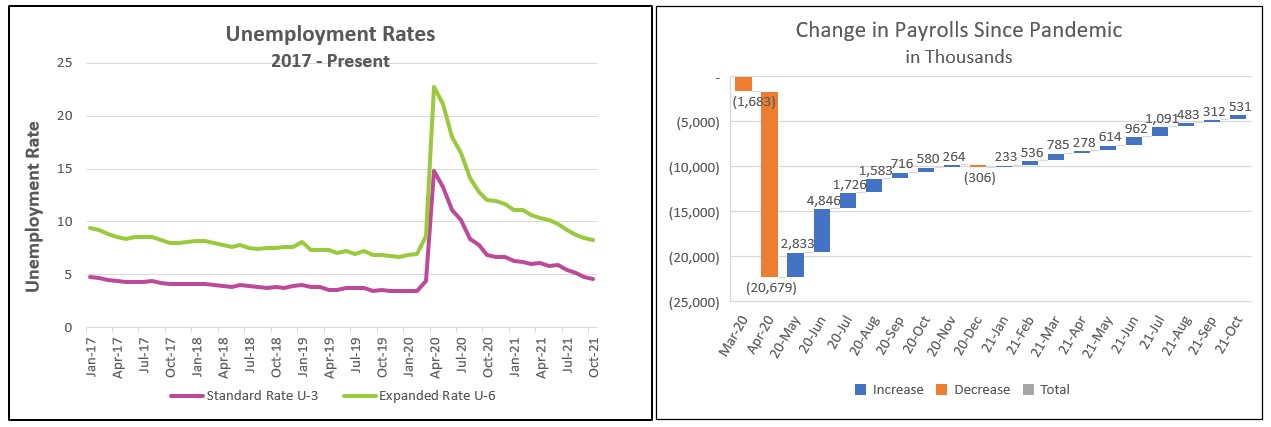
A renewed recovery has pushed employers to hire more workers and increase compensation. Employment increased the most since July, thereby continuing the downward trend in the unemployment rate. Employment gains occurred in most industries. Among the major sectors, only employment in government fell, largely because of a drop in public education. Job openings remain near record levels, enabling workers to negotiate higher wages. But many potential workers remain on the sideline, with 4.2 million fewer people employed than before the pandemic. The highlights from The Employment Situation – October 2021 are listed below.
During the third quarter, the US economy started with a bang. It ended stifled by the spread of the Delta variant of the coronavirus because many people cut back on in-person activities such as eating out and traveling. Hiring slowed from over a million in July to only 312,000 in September. Growth in consumer spending increased 19% in the second quarter, but more COVID cases, higher prices, and the limited availability of large ticket items slowed the growth to 7% in the third quarter. Income also fell because expiring unemployment insurance benefits more than offset the 0.8% increase in wages and salaries.
Suppliers had trouble securing the resources they needed to produce their goods and services. Labor was tight. Distribution bottlenecks sometimes slowed production. Businesses also slowed their investment in plants and equipment and residential builders to cut back. Meanwhile, inflation continued at an alarming pace.
Prosperity will return during the fourth quarter if COVID cases continue to decrease. The start of the fourth quarter is very encouraging. The economy has been tied to COVID, and cases have fallen since a spike in the summer. Households are financially healthy and ready to spend. Incomes will continue to increase, and Americans have accumulated trillions of dollars in savings. Wages are rising as employers seek creative ways to attract workers. All of these will strengthen household spending.
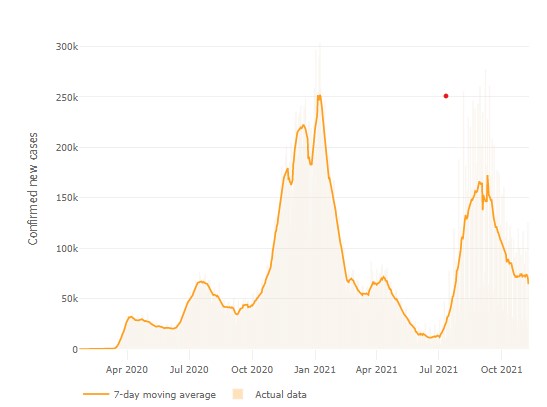
Source: Johns Hopkins
Supply-chain challenges will linger but begin to improve. Job openings remain near record levels. The Wall Street Journal reported there were 11.2 million job openings on November 5th. Fear of contracting COVID has deterred many potential workers from entering the workforce. However, that may be changing. More people are entering the workforce in most sectors of the economy. Payrolls have increased for four consecutive months. In October, not only did leisure and hospitality companies hire workers, but the manufacturing, health care, transportation, and warehousing industries also added people to their payrolls. Fewer COVID cases, higher wages, and depleted savings will continue to entice workers back to the workforce. (Savings as a percentage of disposable income equaled 27.6% in March. Since then, it has fallen to 7.5%.)
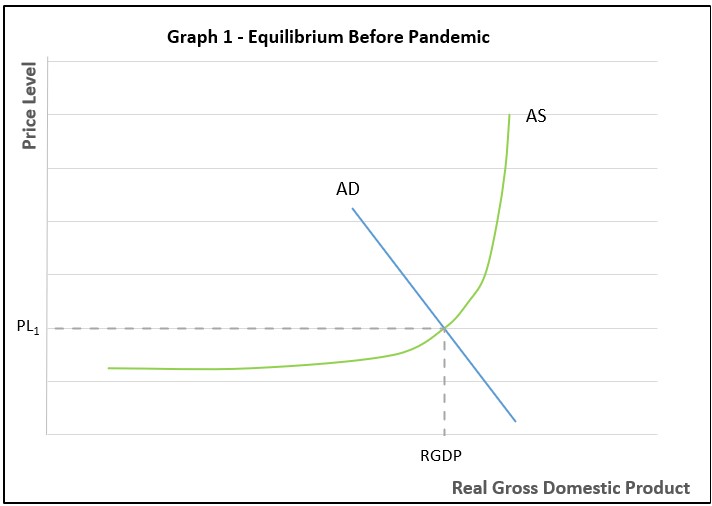
Despite the supply-chain hurdles, the economy will grow five percent or more, the fastest pace in more than three decades. But growth in the aggregate demand and shortages come with a major hiccup – inflation. The graphs below illustrate what has happened. Assume that Graph 1 was the US economy before COVID, where AD is the economy’s aggregate demand, AS is its aggregate supply, PL1 is the equilibrium price level, and RGDP is the equilibrium output.
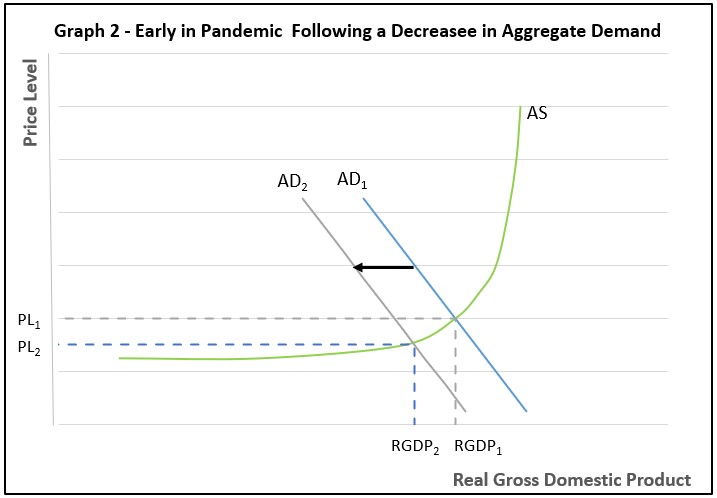
The pandemic started, and the economy suffered sharp drops in its aggregate demand. A recession began, and prices fell, as shown in Graph 2, where aggregate demand fell from AD1 to AD2. Output fell from RGDP1 to RGDP2, and the price level fell from PL1 to PL2.
Congress’s fiscal policy strived to bolster the aggregate demand by supplementing household income with stimulus checks and many programs such as supplemental unemployment insurance to restore household incomes and increase AD back to where it was before. But the economy’s productive capacity was lower. Fewer people were willing to work. Supply bottlenecks resulted, so the aggregate supply did not return to where it was before the pandemic. The result is illustrated by Graph 3. Assume the government was successful at restoring the country’s aggregate demand to AD1. The supply challenges reduced the aggregate supply from AS1 to AS2. Prices increased from PL1, the level before the pandemic, to PL3. The equilibrium output is RGDP3, less than before the pandemic but more than RGDP2.
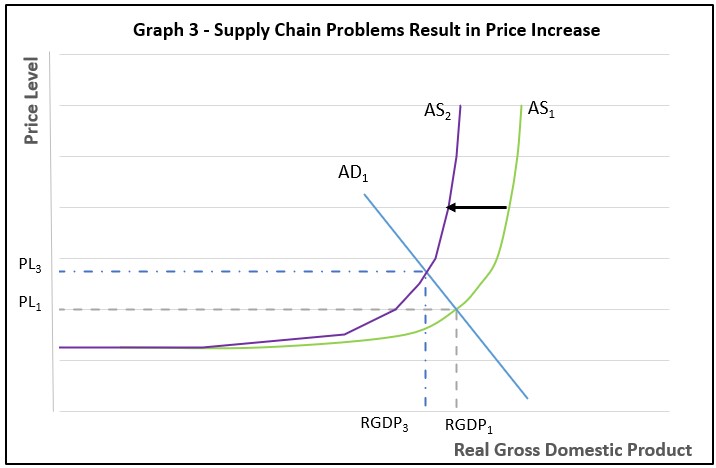
The nation’s aggregate supply will increase as more people return to work, which will diminish supply bottlenecks. The Fed continues to believe that most of the supply issues will resolve themselves, and inflationary pressures will subside. (This can be seen on Graph 3 as a lower price level if the aggregate supply returned to AS1.)
The increase in inflation has been significant enough to get the Fed’s attention. Several months ago, Fed officials believed inflation would quickly subside because of the base effect. Prices of goods and services most affected by the recession dropped the most, which lowered the base, which amplified any increase in prices. October’s data show that inflation is broader than the sectors directly impacted by the economy's reopening. The Fed has a dilemma in balancing its charge of preventing runaway inflation while maintaining a high level of employment. To keep prices in check, the Federal Reserve could raise interest rates to slow the economy. In other words, slow the rate of increase in the economy’s aggregate demand.
People are harmed by inflation when their income does not keep pace with rising prices. Over the prior 12 months, wages increased 4.9% while the price index rose 6.2%. In other words, in most cases, a pay raise has not been sufficient to cover the added cost of goods and services. Hardship is exacerbated because price increases of essentials such as food and energy exceeded the monthly average. Fed officials are concerned that an extended period of inflation will create a self-fulfilling prophecy by creating a cycle where workers demand higher wages because they anticipate higher prices, and companies raise their prices to cover the added expense, thereby pushing inflation higher and higher. According to the University of Michigan’s consumer sentiment index, consumers expect higher inflation in the future. These expectations were the main reason the index fell in October.
Most economists expect the economy will continue to gain momentum. Consumer spending will continue to grow. Fewer COVID cases and higher wages will entice many to return to the workforce. Investments in equipment will improve productivity. Distribution channels will begin to recover. Together these developments will increase the economy’s aggregate supply and soften inflationary pressures. And the Federal Open Market Committee will begin to curb inflation by reducing its asset-buying program and tightening its monetary policy late this year.