State of the Economy - September 2017
The economy remains strong. Unemployment and inflation remain low, while wages are increasing. The economy entered the third quarter growing at 3.1%. Hurricanes Harvey and Irma have probably lowered growth in the third quarter by lowering retail sales, shutting down manufacturing plants, and slowing home-building and home sales. However, the economy is expected to regain its momentum in the fourth quarter when communities rebuild. This should add pressure to wages and prices.
Will the Federal Reserve increase the federal funds rate at their December meeting? I think they will because the economy will continue to grow. I also expect prices to increase.
Real Gross Domestic Product
Real gross domestic product (
RGDP) grew at 3.1% in the second quarter. The
Bureau of Economic Analysis (BEA) released its final estimate of the US RGDP in the second quarter on September 28th. This is revised upward from 3.0% in their report last month. More importantly, growth is significantly higher than in the first quarter when the economy grew at 1.2%. The main source of the upward revision was the private inventory investment was slightly higher than initially estimated.
Consumers spent more in the second quarter. Consumer spending makes up over 60% of the US economy, making it the most important contributor to the nation’s GDP. Consumer spending increased 3.3%, up from 1.9% in the first quarter. All spending categories increased. Durable goods increased 7.6%, nondurable goods was up 4.2%, and spending on services grew 2.3%.
The report confirms that the economy was strong heading into the third quarter. Visit
BEA Gross Domestic Product to read the full report.
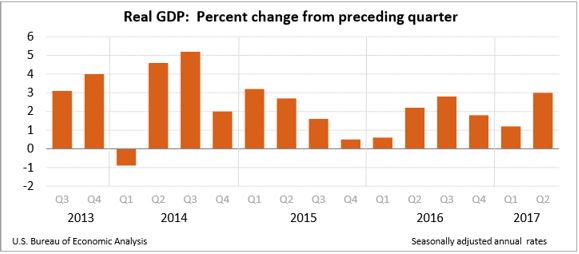
Most economists do not believe 3.0% growth is sustainable, if for no other reason than we are in a very long expansion. The economy has entered its ninth straight year of growth according to the National Bureau of Economic Research. Our current expansion started in June 2009. Only the 1961 - 1969 and 1991 - 2001 expansions have been longer. Growth exceeded 3.0% several times during Mr. Obama’s presidency, but failed to sustain the momentum. The last time the RGDP increase exceeded 3% was in the first quarter of 2015, when the economy grew at 3.2%.
An increase in corporate profits has helped propel the stock market to record highs. Profits after tax were down 2.0% from the first quarter, but they were up 7.4% from a year ago.
Visit our free lesson,
Gross Domestic Product – Measuring an Economy’s Performance, if you would like to learn more about the GDP.
Personal Income and Outlays
The economy has lost some of the momentum it gained in the second quarter, at least for consumer spending, which accounts for over 60% of gross domestic product. Hurricane Harvey and lower vehicle sales are two possible reasons. The BEA released its
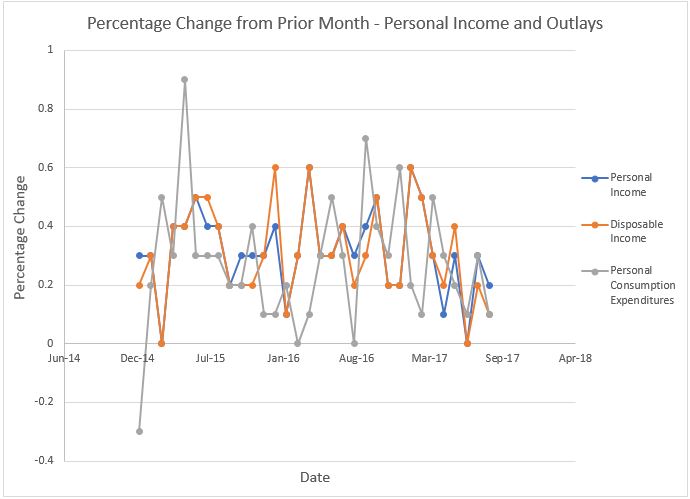
Personal Income and Outlays report for August on September 29th. Personal consumption expenditures (PCE) increased 0.1% in August. This follows a 0.3% increase in July. When adjusted for inflation, PCE fell 0.1%. Most economists believe the hurricanes will impact September’s figures more than August since Harvey hit Texas on August 25th, and Irma and Jose did not hit the US coast until September. PCE is expected to increase in the fourth quarter when the rebuilding begins.
Personal income increased 0.2% in August, but disposable income only increased 0.1% and actually fell 0.1% when adjusted for inflation. This means $100 could purchase less in July than August.
The Personal Consumption Expenditures (PCE) price indexes for August are also included in this report. The PCE price index is favored by the Federal Reserve making it the more important index when evaluating
monetary policy. The core index, which excludes food and energy, dropped to 1.3%. It has continued falling since April when it was 1.6% and remains below the Federal Reserve’s target of 2.0%. When inflation is too low it may be a sign that the economy is not as healthy as some of the growth figures indicate. Normally a growing economy adds pressure to wages, which in turn increases inflation. The
Federal Open Market Committee would like to see a continued increase in wages. The low inflation rate creates uncertainty which may delay the FOMC’s decision to raise the
federal funds rate later this year.
Most contracts that are tied to inflation use the
consumer price index. Unlike the consumer price index, the PCE accounts for changes in spending behavior as the price of a good increases or decreases. For example, the weight given to chicken would increase if consumers substitute chicken for beef following an increase in the price of beef. The consumer price index assumes the items in the basket are unchanged.
The savings rate remained unchanged at 3.6%.
Inflation – Consumer Price Index (CPI)
Most economists expected a greater increase in the PCE August figure after the August CPI figure was released. (The August CPI was released two weeks prior to the PCE index.) One reason for the difference is housing costs increased 0.5% in August, and housing receives a higher weighting in the consumer price index than the PCE index.
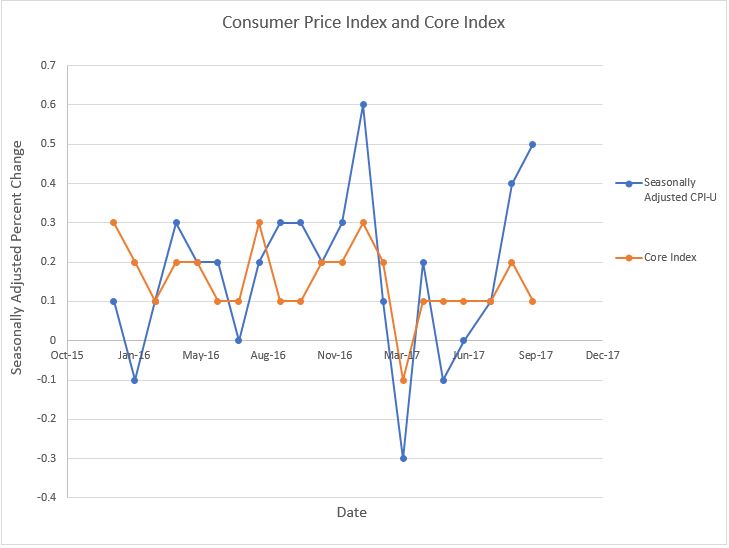
The consumer price index is the most commonly quoted measure of inflation. On October 13th, the Bureau of Labor Statistics released September’s consumer price index. Consumers paid 0.5% more for the basket of goods used to measure inflation in September than they did in August. Prices increased 2.2% over the past 12 months. The core index rose 0.1% last month, or 1.7% since the end of last September. The volatility of energy and food prices is the main reason economists view the core index, which does not include food and energy, as a more reliable measure of inflation.
Hurricane Harvey disrupted the supply of gasoline and contributed to September’s 13.1% jump in gas prices. This follows a 6.3% increase in August. Gasoline prices have increased 19.3% in the past twelve months which explains the bulk of the difference between the core index and all items index.
Are you considering purchasing a new car? It may be a great time. Vehicle prices fell 0.4% in September. To learn the price changes in other sectors of the economy read the BLS report. We encourage you to visit our free lessons Inflation and Causes of Inflation.
Employment
Hurricanes Harvey and Irma made it difficult to discern any long-term trends in employment or economic growth from The Bureau of Labor Statistics September report. Jobs were lost for the first time is seven years. 33,000 jobs were lost in September, but the jobless rate fell to 4.2% in September. It is not surprising that employment in food services lost 105,000 jobs last month since restaurants was one of the industries most affected by the hurricanes. However, it is a bit surprising to see a decrease in the number of jobs, and a drop in unemployment. How does that happen?
The BEA surveys businesses asking for the number of employees on their payroll to determine the number of jobs lost or gained in a period. Last month’s business survey was completed shortly after Irma, when many people did not report to work because they could not get to their job, or the business was closed for a few days. These people were not on payrolls immediately after the storm. However, these individuals were not considered unemployed. An individual must be actively seeking and unable to find work to be considered unemployed.
The BEA surveys households to determine the unemployment rate. This survey is based on what people say. Many who did not go to work still considered themselves employed and intended to return to the same job as soon as they could. The household survey explains the Labor Department conclusion that Harvey and Irma had “no discernable effect on the national unemployment rate”. To learn more about the surveys visit BLS – survey methodology.
The employment report also showed a 2.9% increase in compensation, the largest increase since 2009. This too is misleading because of the storms. Lower paid hourly workers are most likely not paid in the weeks following a storm if they do not work. Higher paid salaried workers are paid, probably making the September’s average a little misleading.
The estimated losses from Harvey and Irma are in the billions of dollars, but people must rebuild. Reconstruction will add jobs in those areas hit. Many economists predict a labor shortage in those areas in the coming months which should put upward pressure on wages.
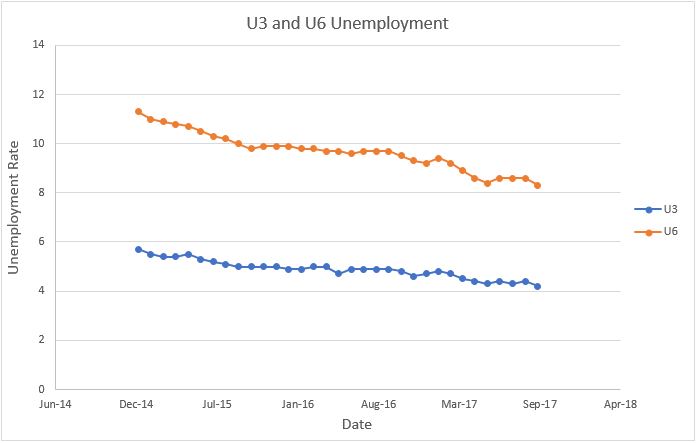
The most widely quoted unemployment rate is the U3 rate, which excludes discouraged workers. For example, someone who lost a job five weeks ago and wants to work, but has decided to wait for the economy to improve would not be included in the U3 rate. Many economists believe the U6 unemployment rate provides a more accurate measure of unemployment. U6 includes discouraged workers. People who want to work, but who have not actively sought employment in the past four weeks are not included in U3, but are included in U6. The U6 rate also considers workers who are employed part-time but want to work full-time as unemployed. The U6 rate is presently at 8.3% down from 8.6% last month. The participation rate increased slightly to 63.1%. The participation rate is the percentage of the total population age 16 or older who are either employed or seeking employment. The drop in the U6 rate and the increase in the participation rate indicates that economic growth is finally benefitting the long time unemployed.
The unemployment rate continues to be below what most economists consider the full-employment rate of approximately 5 percent. Janet Yellen, the Chairperson of the Federal Reserve, and most economists predict that shortages of qualified workers should continue to push wages higher.