The US job market is healthy. Employers continue to hire, and the unemployment rate remains near its half-century low. The labor market’s strength has complicated the Federal Reserve’s efforts to reduce inflation. Policymakers at the Fed increased their benchmark interest rate nine times to slow aggregate demand growth. However, recent reports provide signs that their efforts have begun to bear fruit. Seven trends that point toward a slowing of the economy are discussed below.
The highlights from the Bureau of Labor Statistic’s report, The Employment Situation – March 2023 are listed below.
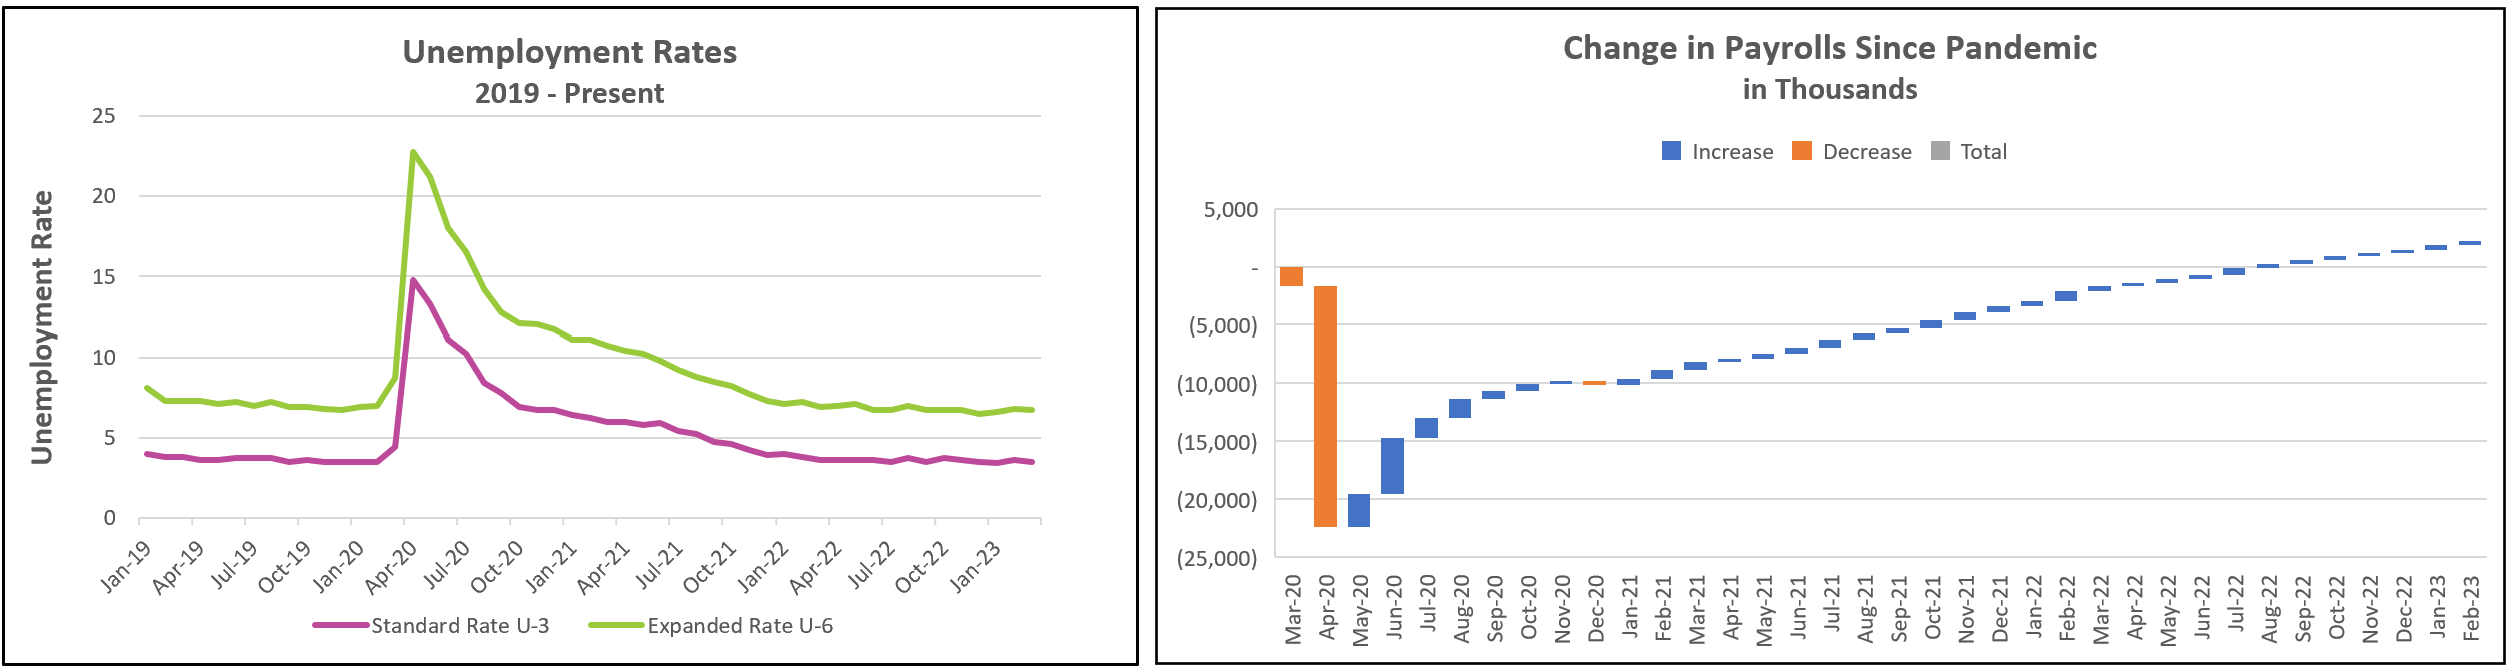
January’s unemployment rate reached a 53-year low of 3.4%. February’s rate increased to 3.6% because the workforce grew by 419,000. But many who entered the workforce in February did not find jobs immediately, and the number of employed increased by 177,000. In March, 577,000 more people were employed than in February, while 480,00 people entered the workforce. March’s unemployment rate fell to 3.5% because the number of employed increased more than the number of people who entered the workforce.
The participation rate measures the percentage of the population willing to work. It includes those who have jobs and those seeking employment. A 0.1% increase in the participation rate means over a quarter of a million people have entered the workforce.
A labor shortage has complicated the Federal Reserve’s quest to lower inflation since the pandemic. Employers have increased prices to offset the higher wages and benefits they have been compelled to pay to attract and retain workers. The shortage decreased in March, bringing the supply and demand for labor closer to equilibrium. The number of job openings fell to 9.9 million, or 900,000 fewer than at the end of January. The participation rate rose to 62.6%, a three-year high. An increase in the labor supply should alleviate some of the pressure on wages.
Employers have added an average of 388,000 workers to their payrolls since January 2022. That far exceeds the 100,000 most economists believe needs to be added to the workforce each month to replace retiring workers and accommodate the increase in population. But the average number of monthly new hires has fallen to 314,500 in the past six months and has trended lower since a surprising surge in January.
A slowdown in hiring is broad-based, with cutbacks in retail (14,600), construction (9,000), and manufacturing (1,000). For construction, it was the first reduction since January 2022. Manufacturing shed workers for the second consecutive month. Companies in the leisure and hospitality industries added 72,000 to their payrolls, down from an average of 95,000 in the prior six months.
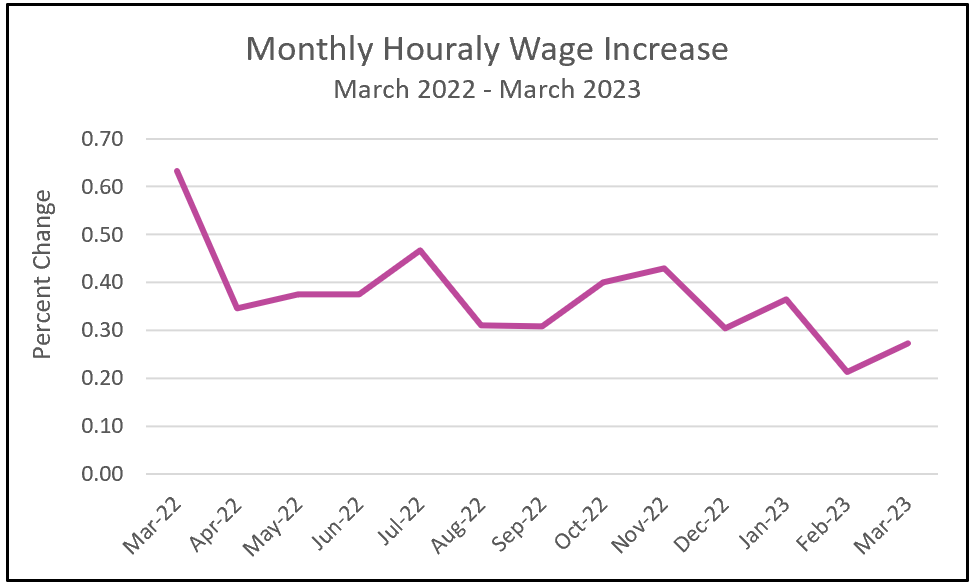
Strength in consumer spending has supported the economy and added to the Fed’s challenge of reducing inflation. Consumers emerged from the pandemic with record savings accumulated from checks received from the federal government. They also had a pent-up demand. The added income and accumulated savings helped finance the growth in consumer spending. Hourly wages also grew as businesses bid up wages to attract the workers they needed to supply the voracious demand for their goods and services. Since March 2022, growth in the labor pool and a softening of labor demand combined to slow the growth in hourly wages.
 Source: BLS Databases, Tables & Calculators by Subject
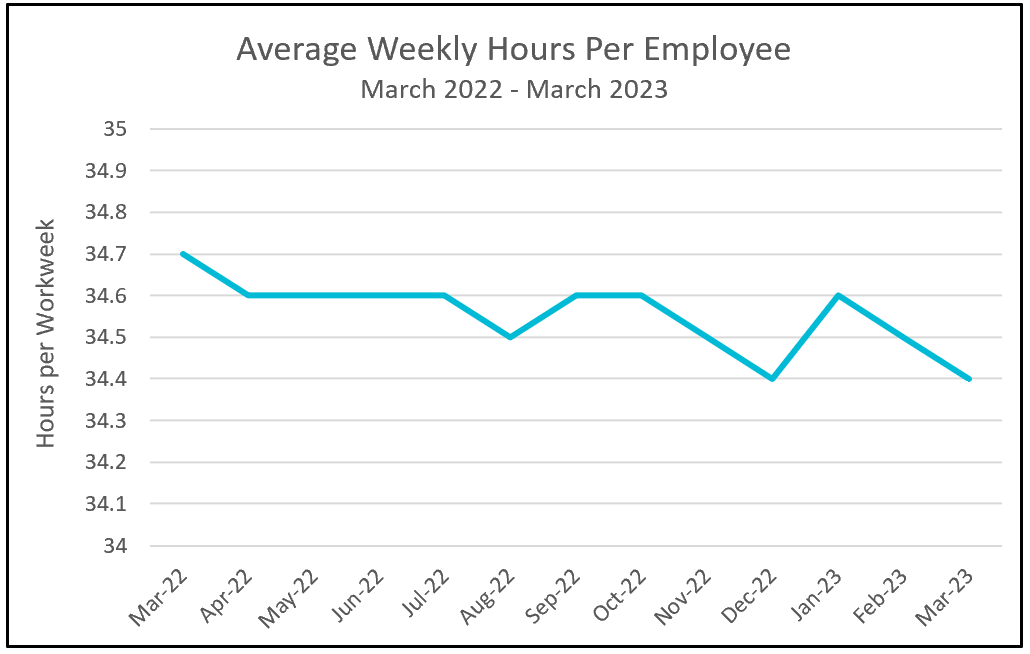
Employers are cutting hours. Not since April 2020, when the workweek equaled 34.2 hours, has the average workweek been shorter. A shortened workweek is a leading indicator of a slowing economy. Demand is likely softening, but employers hesitate to lay off workers with a labor shortage. Therefore, they cut their hours.
 Source: BLS Databases, Tables & Calculators by Subject
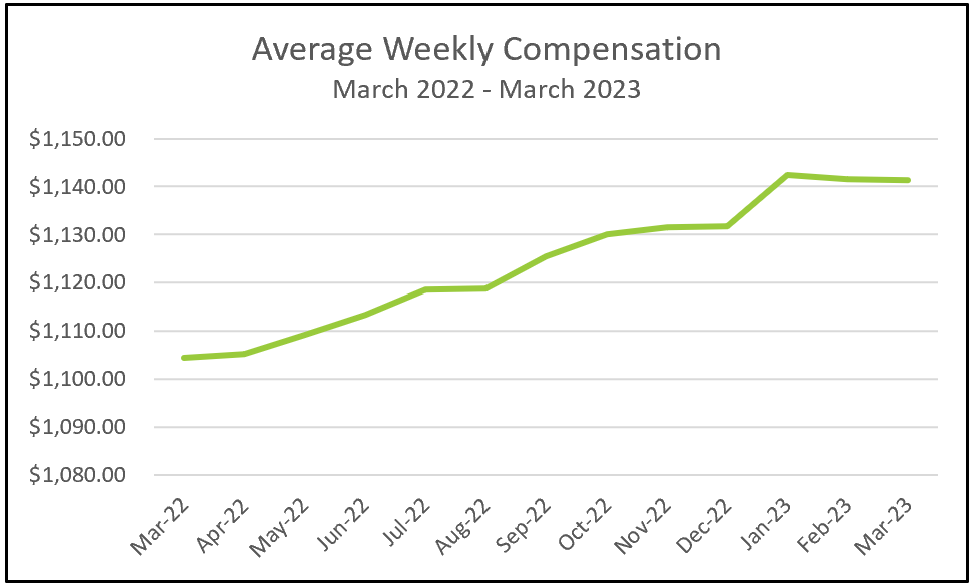
The combination of a shorter workweek and minimal wage gains has reduced total weekly compensation since January. The trend is visible in the graph below.
Source: BLS Databases, Tables & Calculators by Subject
Bloomberg reported on Thursday that the demand for temporary workers has fallen in seven of the last eight weeks. The trend in hiring temporary workers is a leading indicator because temps are the first people hired when an economy emerges from a recession and the first let go when the economy is peaking.
Workers file an initial jobless claim when seeking unemployment benefits after recently losing their job. Economists view initial jobless claims as a leading indicator because companies tend to lay off employees if they anticipate a fall in the demand for their goods or services. Before the pandemic, weekly claims averaged approximately 230,000. They exploded to over six million the week of April 4th, 2020 (FRED). By January 2023, claims fell to historical lows of less than 200,000, as companies hesitated to lay off workers. However, claims have recently trended higher and exceeded 240,000 in the middle of March.
Last year, rising incomes helped fuel growth in consumer spending and the economy’s real gross domestic product. However, wages failed to keep pace with inflation in many households, forcing them to either dip into savings or borrow. Many also borrowed before interest rates increased to satisfy their pent-up demand. The New York Federal Reserve reported that between the first quarter of 2020 and the end of 2022, debt rose $2.6 trillion to $16.9 trillion. The central bank also reported that younger borrowers struggle to pay their debts.
The recent collapse of Silicon Valley Bank and Signature Bank caused instability in the banking sector. Many banks will likely increase their reserves. If they do, they will curtail lending, which would lower business investment. It would also slow consumer spending.
The employment report suggests that inflation is moderating. We will learn more on April 12th, when the Bureau of Labor Statistics releases Consumer Price Index – March 202. Check back to HigherRockEducation.org shortly after its release for our summary and
analysis.