Americans will go to the polls next week. Many of us consider the economy as one of the most important factors in deciding who to vote for, yet many voters are unaware of the state of the economy. We have constructed five graphs that we believe provide a good summary of the economy's progression since January 2017 when this Congress was elected. I have titled this post “
Election 2018 – The Republican Scoreboard” because the Republican party won the presidency, and control the House or Representatives and Senate. We at Higher Rock believe an understanding of economics is essential in helping voters reach the best decision on who to vote for. Only facts are provided along with links to the most recent source of data supporting each graph. If this is useful, please forward this information to friends and family who would benefit from the information provided. Most importantly – Vote.
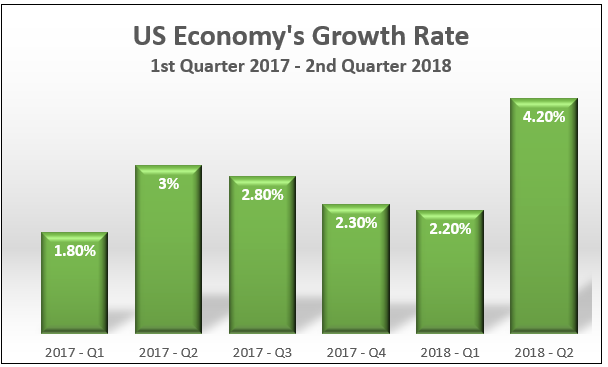
Economic Growth
The percentage changes in the quarterly
real gross domestic product (RGDP) are used to measure the US economy’s growth rate. RGDP increased an average of 2.7% each quarter. The economy has continued to thrive and is approaching a record expansion that began in June 2009. These figures were obtained from the
Bureau of Economic Analysis.
Source: BEANew York Stock Exchange
The New York Stock Exchange (NYSE)’s performance is a measure of investor sentiment on the state of the economy. Record highs have been reached on several occasions during the past two years. The NYSE has increased 28.0% since January 3, 2017.
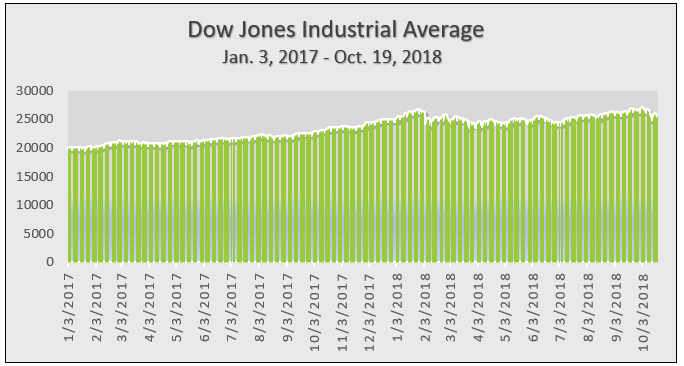 Source: The Wall Street Journal
Real Disposable Personal Income
Disposable personal income jumped over 4% in the first quarter of 2018 largely because tax rates dropped when the new tax laws took effect in January. Lower tax rates increase a worker’s take home pay, i.e. disposable income.
Real figures were used to adjust for inflation. Real disposable income has increased an average of 2.7% since January 2017.
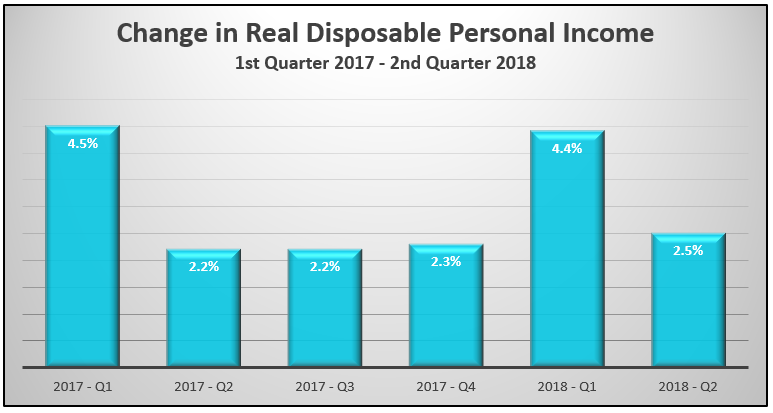
Source: BEA Personal Income and Outlays Table 6
Unemployment
Unemployment has declined 1.1% since January 2017. Quarterly U-3 rates, the most common measure of unemployment, are graphed. U-3 includes working age people who want to work and are unable to find a job. Potential workers who are discouraged and left the work force are not included in U-3 if they have been unemployed for a long time and not actively seeking employment. All other measures of unemployment have decreased as well. The source of data is October’s Bureau of Labor Statistics - The Employment Situation report.
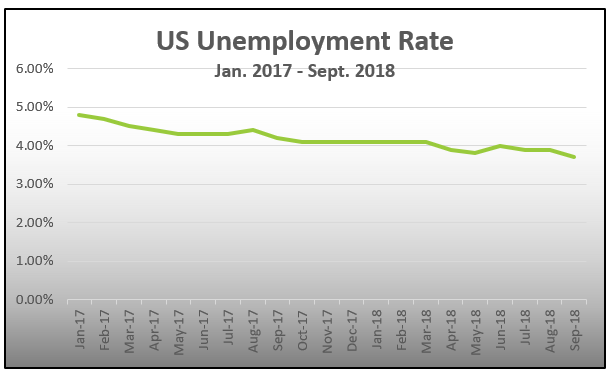 Source: Bureau of Labor Statistics Employment Report
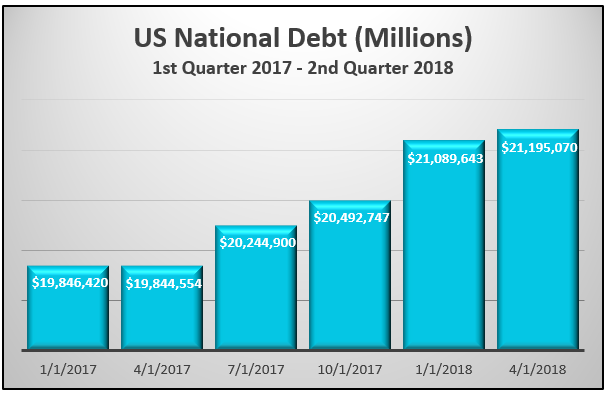
National Debt
The US economic growth has been financed with a combination of lower taxes and increased spending. The national debt has increased 6.8% since January 2017 and exceeds the country’s gross domestic product by nearly 4%. The Federal Reserve Bank of St. Louis has provided the data for the national debt and the percent the debt exceeds the gross domestic product.
Source: Federal Reserve Bank of St. Louis
The state of the economy is one of the most important issues in determining how people vote, but it is not the only issue. I hope this post has helped of our readers make a more informed decision when considering the economy. Please VOTE!