Many economic records have been shattered during the past seven weeks – all of them bad and caused by the containment measures imposed by most countries to control the COVID-19 pandemic. In March, people felt secure in their jobs and were going out to eat, traveling, attending shows at the theater, shopping and rooting for their favorite team at the arena or on television. Now most of these activities have been shut down. Consumer spending had been the strength of the economy. The impact of the containment measures was sudden and enormous. A record 36 million workers have lost their jobs in the United States. Many economists expect the economy to contract 30% on an annual basis. The US government has aggressively implemented fiscal and monetary stimuli to keep businesses open and people spending. What is the current economic picture? Read the summaries of the four reports listed below.
President Trump announced that vaccine or no vaccine the country will be back by the end of the year. In all due respect Mr. President, consumers have the ultimate say in when the country recovers. Feeling safe is what is needed more than anything else before consumers will venture into the market, resume spending, and increase the economy’s aggregate demand to pre-COVID-19 levels. Companies must gain confidence that the demand for their good or service has recovered before rehiring furloughed employees. What are the most important variables that will influence whether this business cycle is “V” shaped (quick recovery) or “U” shaped (longer recovery)? Five are listed in the summary, but the most important factor is consumer confidence.
An economic collapse of the US economy during the final three weeks of March ended the record 11 year expansion. While the US is not officially in a recession, economists generally agree that the United States is in a recession. (Technically, the National Bureau of Economic Research decides when the economy enters a recession and requires the economy to contract for two consecutive quarters.) The US economy shrank following defensive measures taken by governments world-wide to contain the spread of COVID – 19. Consumers stayed at home. Readers can access the report at the Gross Domestic Product, First Quarter 2020, Advance Estimate. Highlighted statistics from the report are listed below.

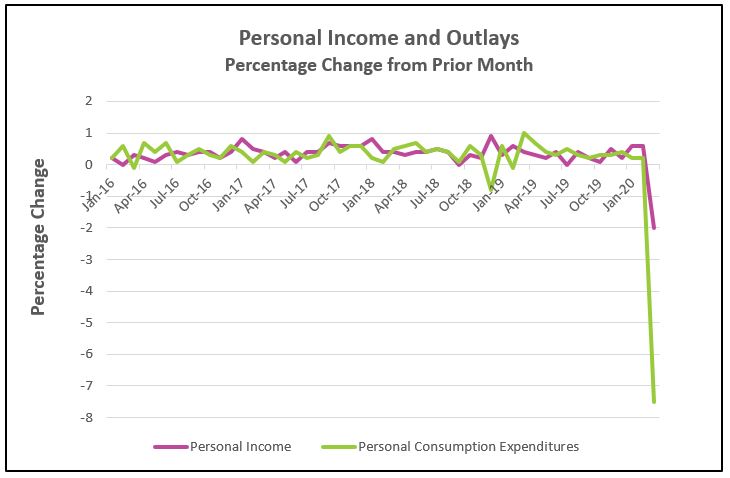
This report is just the beginning of bad news related to COVID – 19 because data used were only a few weeks into the sudden economic impact of the pandemic. By the end of March, the economy seemed to be put on hold. Consumer spending fell more than ever since records have been taken in 1959. Personal income fell. Read the full report by following the link Personal Income and Outlays, March 2020. Telling statistics from the report are listed below.
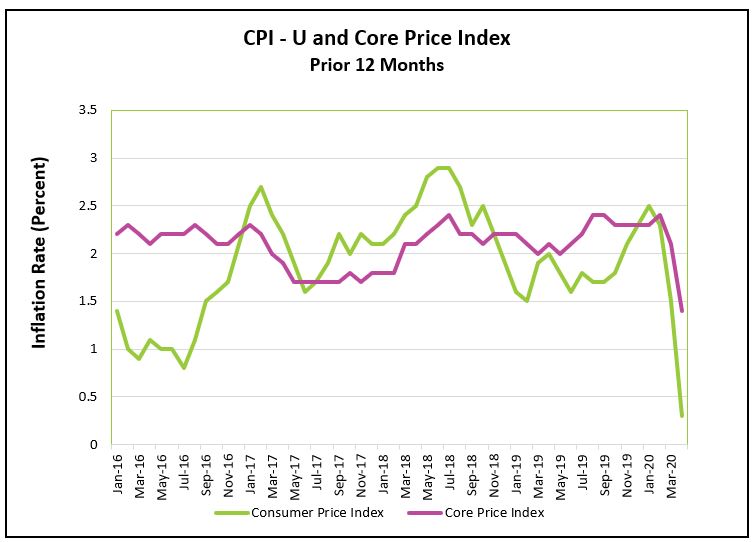
Deflation continued into April when prices fell sharply. People are driving and flying less. The lower demand for gasoline and a price war between Saudi Arabia and Russia pushed crude oil prices to their lowest levels since 2002. However, a sudden increase in the demand for food at home along with supply shortages pushed food at home prices higher in April. Read the full report by visiting Consumer Price Index – April 2020. The most important statistics from the Bureau of Labor Statistic’s report are listed below.
Employment records that were threatened in March were broken in April. A record number of people were laid off and April had the largest recorded increase in unemployment. (The data excludes the Great Depression because unemployment figures were first recorded in January 1948.) The percentage of employed adults also hit a record low. In separate reports the Department of Labor reported that approximately 36 million workers filed unemployment claims since the third week in March. Some statistics from The Employment Situation – April 2020 are highlighted below.

States began issuing containment measures during the last three weeks of March. The impact was severe enough to cause an economic contraction for the entire quarter (13 weeks). Thirty-six million people have lost their jobs in the last two months. Fortunately, most have been furloughed, but April’s decrease was the largest drop in employment recorded. In February, 61% of the adult population was employed. By the end of April, that figure had fallen to 51.6%, again, the lowest recorded. Sadly, the hardest hit are the lowest income groups. For example, over 36% of the jobs lost (7.7 million) were in the leisure and hospitality sector. Hourly compensation in the leisure and hospitality category equals $18, the lowest of any industry group. (See Table B-3 of April’s Employment Situation.) This compares to $30.01 for all privately employed workers.
It is remarkable that in only three months, unemployment increased from 3.5%, the lowest recorded in 50 years, to 14.7%, the highest recorded! The actual rate is closer to 19%. To be considered unemployed an individual must be seeking employment. Many people who were recently let go have chosen to wait before reentering the workforce because they are either disheartened by the current economy or fear contracting the coronavirus. These discouraged workers are not included in the unemployment rate and partially explains why the increase in the U-6 rate, which includes discouraged workers exceeded the increase in the unemployment rate.
The silver lining is that 18.1 million of the recently unemployed have been furloughed, meaning their job losses should be temporary. How soon furloughed workers return to work depends on how quickly consumers resume spending when governments open their economies. Most states are reopening in phases. Clearly that is the first step in a recovery, but just reopening does not mean the economy will immediately rebound. Will the recovery be “V” shaped (meaning short in duration), or “U” shaped, (meaning several years)? The answer depends largely on these five factors.
Consumer Comfort – Consumers are concerned. Fear deters purchases of many goods and services. Rather than spending, consumers are saving. Savings as a percentage of disposable income increased from 8.0% in February to 13.1% in March. Households try to save when they fear a drop in income. The University of Michigan’s Index of Consumer Sentiment suffered the largest drop ever recorded in early April largely because of the coronavirus pandemic. Even after the restrictions have been lifted many consumers will remain reluctant to travel, visit restaurants, or attend the theater or sporting events. Probably nothing would improve consumer comfort and prompt consumers to resume spending at higher levels faster than a readily available safe vaccine and / or a cure for COVID – 19. The aggregate demand would increase as consumers venture into the market more frequently. But without a cure or vaccine the risk of reopening too soon is that the economic contraction would deepen and lengthen if a spike in cases of COVID-19 makes it necessary to reimpose restrictions. It would take even longer to regain the public’s trust needed to reopen the economy.
Business Confidence – Understandably, most of the media’s attention has focused on the drop in consumer spending because consumer spending comprises approximately 66% of the economy. But other components of the gross domestic product have fallen. Business investment decreased in each of the last four quarters. In the first quarter of 2020, investment decreased 5.6% following a drop of 6.0% in the fourth quarter of 2019. The trend is getting worse. The Federal Reserve reported that manufacturing output was 6.3% lower in March, the largest drop since February 1946. Last year, the trade disputes between the US and China made companies reluctant to invest. Now it is the uncertainty of when the demand for their goods and services will recover. Some businesses will be slow to rehire fearing a second surge in coronavirus cases even after states reopen.
The Effectiveness of Government Actions – Personal income decreased 2.0% in March. How much will the loss of income deter future purchases? The economic downturn pressed Congress into quickly passing the Coronavirus Aid Relief, and Economic Security (CARES) Act. Congress is trying to help households while limiting the drop in consumer spending. Individuals and families are beginning to receive their coronavirus stimulus checks, where individuals could receive $1,200 and a family of four could receive a $3,400 tax-free payment. (Visit Kiplinger's calculator to learn how much you are eligible to receive.) In addition, unemployment benefits have been increased by $600 per week and the number of weeks an individual may receive benefits has been extended.
The Paycheck Protection Program provides businesses with short-term loans to assist struggling companies with the liquidity needed to endure the shutdown. Employers have an incentive to continue paying their workers even though they are not working because the loans would be forgiven if companies continue to pay workers for eight weeks. The initial $350 billion Congress allocated to this program quickly dried up and Congress appropriated $320 billion more. However, The Wall Street Journal reported in PPC Changes Trip Up Small Businesses that there has been frustration among businesses because the rules seem to have changed. Many companies have returned the money after being advised that the regulations are more stringent than initially believed.
The Federal Reserve responded promptly to help cash strapped companies by making it easier for businesses to borrow. But the Federal Reserve does not make grants and borrowers must still qualify for a loan. Lowering rates and making credit more readily available may buy time, but these actions will not bring the consumer back, and for many companies, survival depends on the customer returning sooner rather than later.
How Many Companies Survive – Bankruptcies have already increased. Neiman Marcus, JCPenny and J Crew are among the larger companies that have already declared bankruptcy. They may have declared bankruptcy without the pandemic, but there is no doubt that government containment measures lessened their chances of avoiding bankruptcy. Airlines are threatened if travel doesn’t increase soon. The same is true of cruise lines and many more industries.
In 2018 small businesses employed 47.5% of the labor force (SBA – 2018 Small Business Profile). Most small companies average 27 days in cash reserves according to a 2015 study by JPMorgan Chase sited in Business Insider. An extended contraction will consume these reserves. Businesses can buy time by drastically cutting costs, but in the end, many small businesses will close. Every closure delays the recovery. For example, suppose a restaurant closes. If there is a V shaped recovery, and the restaurant survives it would be able to bring its employees back. But if the restaurant closes, the workers lose their jobs. They spend less while they are searching for a job, which reverberates throughout the economy. A new restaurant may enter the market and eventually absorb the workers but that takes time. Whether the recovery is V shaped or U shaped will be influenced by how many companies survive.
How consumers and businesses respond to deflation – The recent demand shock has sent prices of most goods and services lower. The price level fell in April and March. The commodities, goods, and services that are most directly influenced by the containment measures have seen the largest decreases in prices. These include gasoline (20.6%), lodging away from home (7.1%), and airlines (15.2%). Deflation is not an immediate concern, but it could slow any recovery if it is prolonged. Economists fear deflation because consumers and businesses may choose to delay purchases, expecting the price of a good or service to be lower tomorrow. If deflation worsens, it could prolong the recession.
This recession has been compared to the Great Depression, but this recession is very different. The economy’s underlying strength is healthier, and the prompt fiscal and monetary responses will diminish this recession’s hardship. But how consumers and businesses respond in the next few months will ultimately determine whether the contraction is V or U shaped. Hopefully, the government programs will maintain the economy’s aggregate demand high enough to enable businesses to survive long enough so the furloughed workers are rehired. Consumer and business confidence should improve barring a surge in coronavirus cases and reinstating containment orders. I expect a new expansion will begin in the third quarter.
Stay Healthy