State of the Economy - March 2017
The March reports are in. The economy continues to grow. Unemployment continues to decline which has resulted in wage increases. Prices have increased more in March than any month since February 2013. I expect inflation to continue to rise because the combination of a growing economy and an unemployment rate of less than five percent pressures employers to increase wages to retain and attract workers. I also expect the Federal Reserve to tighten
monetary policy if inflationary pressures continue to increase.
Please note we have tried to use the most updated information in our graphs, but these figures are constantly revised. Links to the sources have been provided so readers can secure the most up to date figures.
Real Gross Domestic Product
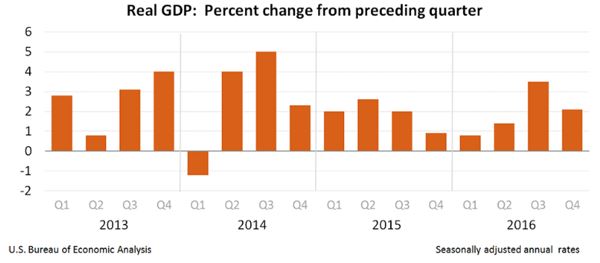
The US economy continues to grow and is well into its seventh year of expansion, but growth was less in 2016 than in 2015, largely because the pace slowed between the third and fourth quarters.
Annual: In 2016, the US real gross domestic product (
RGDP) increased 1.6 percent. This compares to a growth rate of 2.6 percent in 2015. RGDP is the most common measure of economic activity because it adjusts the gross domestic product (GDP) for inflation, making it easier for economists to measure economic growth over many years.
GDP is the market value of all the goods and services manufactured in the country in a year. At the end of 2016, the United States' GDP equaled $18.87 trillion (See our free lesson
Business Cycles.)
Quarterly: During the third quarter of 2016 the economy grew at 3.5 percent, but growth slowed to 2.1 percent during the fourth quarter. The fourth quarter figure was revised upward from 1.9 percent. Consumer spending continued to contribute to the growth in the RGDP in the fourth quarter. Growth in residential and commercial construction as well as an increase in state and local government spending helped fuel our growth. Business profits increased $11.2 billion during the fourth quarter, but not at the robust pace of $117.8 billion in the third quarter.
Growth was not as high in the fourth quarter because federal spending was down and the trade deficit continued to widen. Imports increased while exports decreased. The continuing weakness in many of the European and Asian economies has reduced the demand for exports. A drop in federal government spending also slowed the growth rate. Visit
BEA Report to read the full report. These figures will be revised in the coming months. The next revision is scheduled to be released on April 28, 2017.
To learn more about how the GDP and RGDP is calculated visit our free lesson
Gross Domestic Product – Measuring an Economy's Performance.
Personal Income and Outlays
On March 31st, the
Bureau of Economic Analysis (BEA) reported that personal income increased $57.7 billion or 0.4 percent in February. This compares to an increase of 0.5 percent in January. Real personal income increased 0.2 percent. In 2016, personal income increased 3.6 percent, down from the 4.4 percent increase in 2015.
Disposable personal income increased 0.3 percent in February, down from the 0.4 percent increase in January. Most economists expect wages to continue increasing as the competition for qualified workers grows. The savings rate equaled 5.6 percent, up from the 5.4 percent rate in January. For a full report visit
BEA Personal Income.
The graph below illustrates recent trends in personal and disposable income and consumption.

Source:
BEAInflation
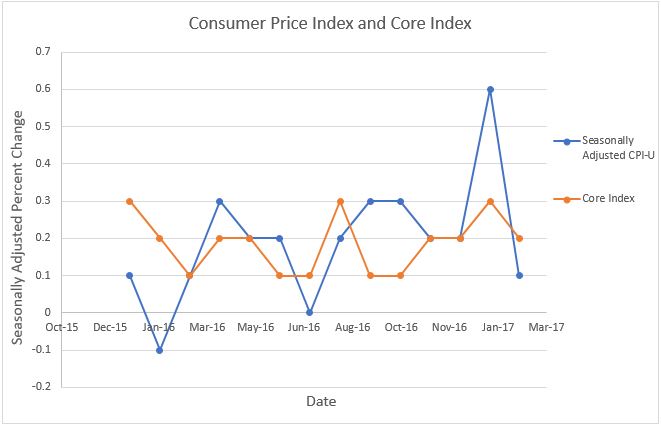
During February, the
consumer price index (CPI) increased a seasonally adjusted 0.1 percent, down sharply from the 0.6 percent increase in January. This increase was the lowest since July 2016. For the past twelve months, the index has increased 2.7 percent. (See graph below.) The volatility of gasoline prices was the largest reason for the significant change in the CPI between January and February. Gas prices increased 7.8 percent in January and dropped 3 percent in February. The
core price index, which excludes energy and food costs, increased 0.2 percent in February, down 0.1 percent from January. Over the past twelve months the core index has increased 2.2 percent, which exceeds the Federal Reserve's target of 2.0 percent. The core index has not exceeded 2.0 percent since 2011. Economists favor the core price index when analyzing inflation because it negates the volatile fluctuations in the energy and food markets. For example, using only March's CPI may have led to the wrong conclusion that the economy was showing alarming signs of slowing down because of the large drop in the price level. However, using the core index provides a more realistic story that the economy is quite stable, and there is little reason to be alarmed by the sudden change.
To read the full report released March 15th visit
Bureau of Labor Statistics - Inflation. To learn more about inflation we encourage you to visit our free lessons
Inflation and
Causes of Inflation.
Source:
BLSEmployment
The employment picture continues to improve. Unemployment continues to decline and there is evidence of a tightening labor market which should lead to higher wages (and higher inflationary pressures). In March the unemployment rate dropped from 4.7 percent to 4.5 percent. Businesses are hiring. A total of 98,000 non-farm jobs were added, down from 219,000 in February. Retail was the only sector to experience lower employment. It lost 30,000 jobs in March and 89,000 since October 2016. Construction employment has experienced large gains in recent months following an improvement in residential construction and the anticipated increase in infrastructure spending. In February it added 59,000 jobs, however hiring slowed to only 6,000 jobs in March. The labor participation rate remained at 63 percent. For the full report visit:
BLS – Employment Situation.
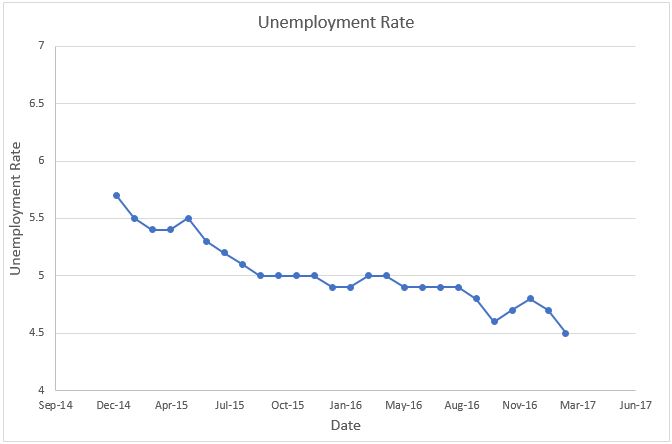
Source:
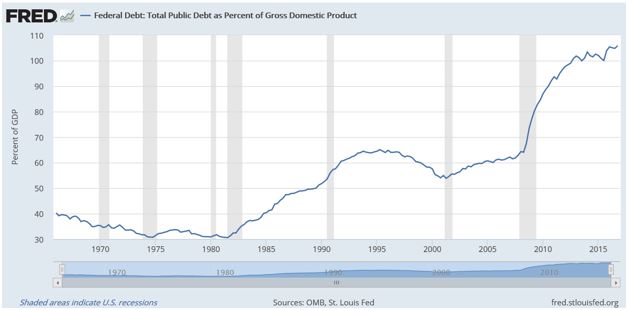
BLSNational Debt
The US national debt now exceeds the nation's gross domestic product by 5.87 percent. This is up from 4.8 percent at the end of the third quarter of 2016. What does this mean? The best measurement for a debt's affordability, whether it is a family purchasing a new home or a country, is the relationship between debt and income. The US national debt now exceeds its income, and the trend is becoming more alarming.