State of The Economy - May 2018
The US economy remains healthy and growing stronger. Unemployment fell to its lowest level in 18 years. The economy grew at 2.2% in the first quarter and most economists believe growth will exceed 3% in the second quarter. Payrolls have increased for a record of 92 straight months, providing consumers with the money to continue buying. Inflation remains tame. The fiscal stimulus of lower tax rates should fuel continued growth. But how long can the growth last? Should the economy be slowed down?
The increase in wages has been slow but gaining momentum. Why? Many Americans have chosen to not seek work until now, resulting in a low participation rate and high U-6 rate. (The BLS defines U6 as the “
Total unemployed, plus all persons marginally attached to the labor force, plus total employed part time for economic reasons, as a percent of the civilian labor force plus all persons marginally attached to the labor force.”) These workers are not included in the official U-3 unemployment rate. Higher wages and better job prospects have induced many of the people included in U6 to return to the job market. When a labor market tightens, those who normally find it difficult to find a job benefit the most. In May, employment of high school dropouts and workers with only a high school diploma improved more than other groups. In other words, the supply and demand for workers has increased, resulting in less wage inflation than many economists anticipated. Eventually, most of those who are interested in returning to the labor market will have returned, so the potential supply will be limited. (This is particularly true if immigration laws reduce the number of workers.) At that time, I believe the demand for workers will outpace the increase in supply, resulting in higher wages.
As expected, the Federal Reserve increased the
federal funds rate a quarter of a percent in their June meeting to 1.75%. Chairman Powell reported that “
The economy is doing very well. Most people who want jobs are finding them, and unemployment and inflation are low.” Watch Chairman Powell’s press conference on
CSPAN. Added consumer spending, growing incomes, and a higher demand for workers will fuel inflation. Three increases in the federal funds rate had been targeted for 2018, but it is becoming more likely the robust economy will prod the
FOMC to raise the federal funds rate four times. The current expansion is one of the longest. It will eventually end. When it does, the Federal Reserve will want to have room to lower rates. At the current target federal funds rate of 1.75% there is little room to lower rates when
expansionary monetary policy is needed.
The individual reports discussed in this blog may differ in actual numbers due to differences in the methodology used and the time they are published, but they all conclude the economy is growing. Indications are we are nearing the peak of a business cycle.
Real Gross Domestic Product (RGDP)
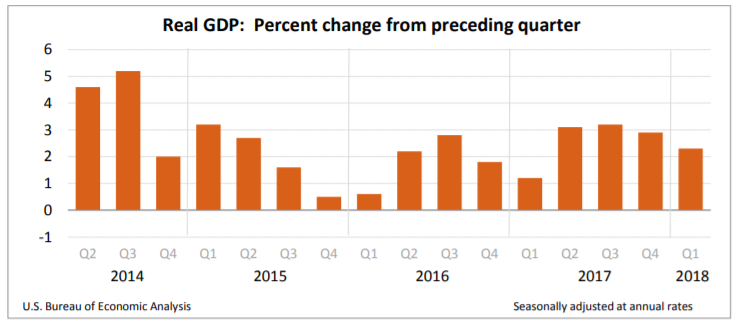
The US economy grew at a slower pace than initially reported in the first quarter. In its news release on May 30th , the BEA revised its estimate of economic growth in the
real gross domestic product (RGDP) down slightly from 2.3 to 2.2 percent. (
BEA News Release May 30, 2018) This follows an increase of 2.9 percent in the last quarter of 2017. Why? The main reason is consumers slowed their pace of spending. Consumer spending comprises approximately 2/3rds of the economy.
Personal consumption expenditures (PCE) grew at 1% in the first quarter, which is the smallest increase in five years after rising 4% in the last quarter of 2017. This can partially be explained by the destructive weather in the second half of 2017 which forced families to pay for repairs and automobiles, causing the sharp increase in the purchase of durable goods at the end of the year.
The largest changes were on the corporate side. Beginning in January the highest corporate tax rate fell from 35% to 21%. This is reflected in the jump in after-tax profits. After-tax corporate profits climbed 7.8% compared to just 0.1% a year ago.
Families are beginning to see less tax withheld from their paychecks. Recent tax cuts have provided families with more
disposable income. Disposable income increased 3.3% in the first quarter of 2018, compared to 1.2% in the last quarter of 2017. While the 1% increase in PCE was disappointing and puzzling, the growth in disposable income is expected to generate a jump in PCE during the second and third quarters.
It is important to note that we are currently nearing the end of the second quarter. This report is for the first quarter of 2018. Other reports in this blog indicate the economy has improved during the second quarter. I expect the BEA's second quarter reports will conclude that GDP has grown at a faster clip than the first quarter. The initial report for the second quarter is due in July. Visit our free lesson,
Gross Domestic Product – Measuring an Economy’s Performance, if you would like to learn more about the GDP.
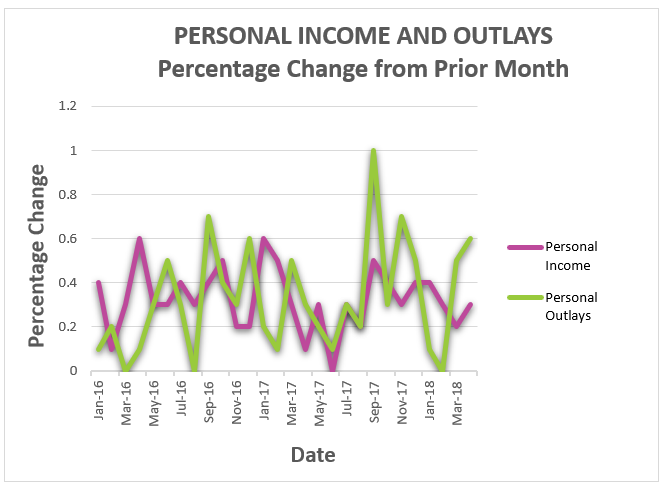
Personal Income and Outlays
A higher than expected growth in consumer spending should continue to fuel economic growth in the second quarter. The BEA released its April report on May 31st and consumer spending increased 0.6%, the most in five months. The BEA also revised March’s spending up from 0.3% to 0.4%. Consumer spending accounts for approximately 66% of the GDP. The largest increase in spending was for nondurable goods, of which gasoline is a large component. These figures are stated in nominal terms and do not take into consideration the 1.5% monthly jump in energy prices. After factoring in inflation, real spending increased 0.4%.
Income did not keep pace with the growth in spending. It only increased 0.3%, but that is still up from the 0.2% gain in March. As expected, this pushed the savings rate down to 2.8%, the lowest it has been since the change in the tax law.
The increase in
aggregate demand is generating
demand-pull inflation. The
PCE price index increased 0.2% in April, the fastest monthly pace since January. Over the past twelve months prices have increased 2%. This is unchanged from March but remains the highest this year. More importantly, the
core price index, which excludes volatile energy and food prices, increased 1.8% in April. The Federal Reserve favors the PCE price index over the more commonly quoted consumer price index. Its target is 2.0%. These figures suggest the economy will continue to grow into the second quarter, but price increases will probably exceed 2.0%, in which case the Fed is expected to continue its credit tightening policy. For the full report visit
BEA May Personal Income and Outlays.
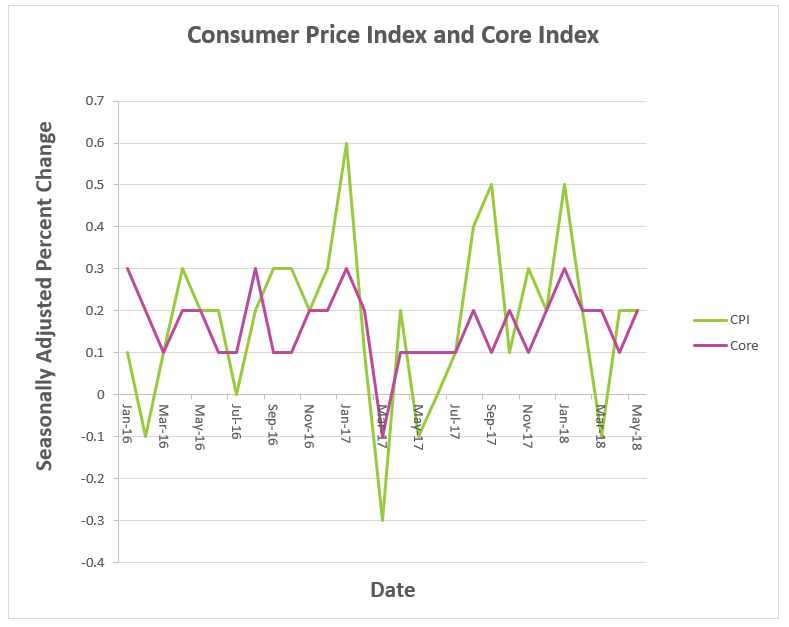
Consumer Price Index
The Bureau of Labor Statistics released its latest report on June 12th. (Read
BLS CPI report.) Seasonally adjusted prices increased 0.2% in May following an increase of 0.2% in April. The index has increased 2.8% over the prior 12 months. Most of the volatility can be explained by changes in gasoline prices which increased 1.7% in May. This follows a 3.0% increase in April. Over the past 12 months, the gasoline index has increased nearly 22%! The volatility of energy and food prices explains why economists prefer the core index, particularly when monitoring changes from month to month. However, just relying on the core index does not provide the full picture either. After all, consumers must purchase gas and food. The core index increased 0.2% in May and 2.2% over the past 12 months.
Workers are gaining purchasing power. In a separate report, the BLS reported that real wages (wages after inflation) increased 0.1%. (
BLS Real Earnings Summary)
Most indicators continue to point to higher prices in the coming months. I believe the labor market will continue to tighten, and wages will continue to rise. Consumer spending will continue to increase as incomes rise, which will increase aggregate demand. A trade war, and the added cost of tariffs will be passed through to consumers as higher prices if the proposed tariffs are implemented. (See blog –
President Trump’s Proposed Tariff – The Economics.)
Employment
Unemployment continues to fall! Employers added 223,000 jobs in May, and the unemployment rate fell to 3.8%, its lowest level since 2000, according to the Bureau of Labor Statistics job report released on June 1st. Those who have traditionally had the most trouble finding work gained the most. For example, high school dropouts experienced a 0.5% increase in employment. The group with only a high school education improved 0.4%. This compares to a 0.1% among workers with a bachelor’s degree or higher.
Improvement is seen across all sectors. Retail, construction, health care and services benefited the most. In the service industries only the temporary help services saw a drop in employment. In manufacturing, motor vehicles and parts suffered the most. Finally, discouraged and part-time workers seeking a permanent job are returning to full-time employment. The U6 rate, which includes this group fell to 7.6%.