State of The Economy - September 2018
The Federal Reserve increased interest rates in late September. Why? Because the US economy continues to thrive. In fact, there is some concern it is growing at an unsustainable pace and the
expansionary policy of low interest rates to induce growth is now inappropriate. There is a greater risk of the economy overheating. Higher rates slow the pace of economic growth because they increase the cost of purchasing items such as homes and vehicles. Chairman Jerome Powell described the state of the US economy in his press conference, September 26th following the Fed's decision to increase the federal funds rate:
Our economy is strong. Growth is running at a healthy clip. Unemployment is low, the number of people working is rising steadily, and wages are up. Inflation is low and stable. All of these are very good signs.... Each time my colleagues and I meet, we face the same question: How can we set policy to best support job growth and low, steady inflation? For many years, this question called for very low interest rates to help an economy that had been damaged by the deep financial crisis that gripped the world 10 years ago. As the economy has steadily gained strength, the Fed has been gradually returning interest rates closer to levels that are normal in a healthy economy. We took another step on that path today with a quarter-point increase in short-term interest rates. These rates remain low, and my colleagues and I believe that this gradual return to normal is helping to sustain this strong economy for the longer-run benefit of all Americans. For a full transcript Chairman Powell's Press Conference September 26.
Yesterday, the Federal Reserve Bank of Atlanta predicted the US economy grew at 4% in the third quarter using its
GDPNow model. GDPNow is frequently updated as an unofficial estimate of the
real gross domestic product (RGDP) prior to the release of the BEA’s official measure. If accurate, the US economy’s growth in the third quarter was down slightly from the 4.2% pace in the second quarter. Despite the lower figure, the US economy continues to extend its near record expansion and is showing few signs that there will a substantial slow down in the near future. As Chairman Powell mentioned, the job market is excellent. Unemployment dipped to 3.7%, the lowest it has been since December 1969. Workers continue to benefit from wage increases that exceed inflation. (Wages were up 2.8% over the prior 12 months, while inflation was 2.3%). Many economists, including me, were wrong when we predicted inflation would increase at a faster clip as unemployment fell to record levels and companies approached their capacity. I stubbornly adhere to this belief and believe prices will increase more in the coming year.
Fiscal stimuli will continue to bolster the economy’s
aggregate demand, which causes
demand-pull inflation. Changes in the tax law have stimulated growth. Consumers and businesses have more money to spend. Federal spending continues to grow. Spending has increased an average of 3.4% per quarter during the past three quarters. This compares to an average increase of 0.14% since the first quarter of 2014. (Read our lesson
Fiscal Policy – Managing the Economy By Taxing and Spending to learn more about fiscal policy and inflation.)
There are other macroeconomic forces pushing interest rates higher. Budget deficits have been growing. The Treasury Department reported yesterday that the Federal government had a $779 billion deficit in the fiscal year ending September 30, 2018, a startling figure for a robust economy that is near a record expansion. The deficit is the highest in six years and 17% greater than in 2017. Tax receipts increased less than 1%, while spending increased 3.2% between 2017 and 2018. The Trump administration believes the lower rates will generate continued economic growth that will add to tax revenues in the future. (Follow the link to the
Treasury Department release.) Higher deficits push up interest rates because the federal government competes with the private sector for borrowed funds. Economists refer to this as the
crowding out effect. For more on the federal debt see the discussion below on the relationship between the national debt and gross domestic product.
Real Gross Domestic Product
The
Bureau of Economic Analysis (BEA) released its third estimate of the US economy's second quarter growth on September 27th. There was little change. The report’s main points include:
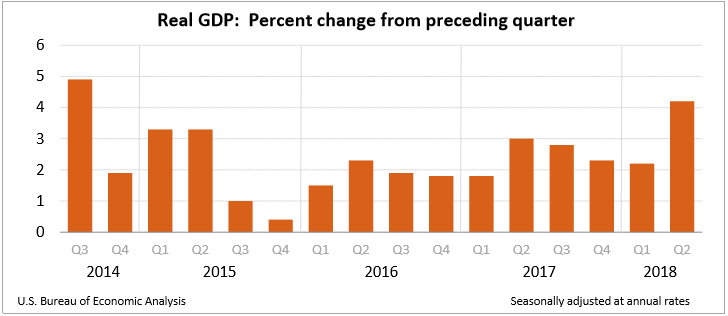
- Real gross domestic product (RGDP) grew 4.2% in the second quarter of 2018 which is the fastest pace since the third quarter of 2014.
- Consumer spending was up 3.8%.
- Corporate profits increased 16.1% or $65 billion between the first and second quarters.
- Real gross domestic income rose 1.6% following a 3.9% increase in the first quarter.
Second quarter growth exceeded President Trump's goal of 3% and most economists predict the economy grew at approximately 4% in the third quarter. The primary drivers include consumer spending and corporate profits. Consumer spending comprises approximately 66% of economic activity and its continued growth is essential to prolong the expansion. Corporations have benefited from lower tax rates and more favorable tax laws. This is seen in higher profits, which should be used to finance continued growth.
Real gross domestic income (RGDI) only increased 1.6% in the second quarter. Theoretically, RGDP and RGDI should be equal because a purchase by one person is income for the seller. In the first quarter RGDI grew at 3.9% compared to RGDP growing at 2.2%. Many economists believe the average of RGDI and RGDP is a more accurate portrayal of growth. In the second quarter the average grew at 2.9% compared to 3.1% in the first quarter. (For a more detailed explanation of the relationship between an economy’s production and income visit
Gross Domestic Product – Measuring an Economy’s Performance.)
Personal Income and Outlays
The BEA published its Personal Income and Outlays report for August on September 28th. To read the full report visit
BEA’s Personal Income and Outlays – August 2018. The highlights include:
- Growth in personal consumption expenditures slowed from 0.4% in July to 0.3% in August.
- Personal income increased 0.3% in August, which is unchanged since last month
- Inflation as measured by the PCE price index remained tame.
- The savings rate remained at 6.6%.
Consumer spending has continued its slow drop since February when the tax cuts put more money into consumer pockets. Spending has decreased from a robust pace 0.6% in February to a more sustainable pace of 0.3% in August. This rate of spending should help prolong the current business expansion.
An increase in wages is essential to support consumer spending in the long-run. Wages and salaries increased 0.5% in August, which is the largest increase since January. Income is outpacing inflation. Real disposable income increased 2.9% since last August, while real prices increased 2.2%, when all items are included. The
core price index, which excludes food and energy prices increased 2.0% over the past year. Both readings are in line with the Federal Reserve target and little changed from July. (In July the PCE price index was 2.3% for the prior 12 months but matched the 0.1% increase for the month.)
Consumer Price Index
The BEA and the Bureau of Labor Statistics (BLS) have separate measures of inflation. The primary difference is the BLS measures the increase in the cost of identical baskets of goods and services in different periods. It does not account for people substituting one good for another following the price change of a
related product. For example, if the cost of beef increases, consumers may purchase more chicken. The BEA’s measure accounts for these changes. The Federal Reserve favors the BEA’s PCE price index. However, the BLS index is more widely followed because it is published first. (For a more detailed discussion of the differences in methodology between the BLS and BEA visit
Inflation.) The highlights of the BLS September
Consumer Price Index Report include:
- The Consumer Price Index for All Urban Consumers (CPI – U) increased 0.1% in September.
- The index has increased 2.3% over the prior 12 months.
- The core index remained at 0.1% in September and 2.2% for the prior 12 months.
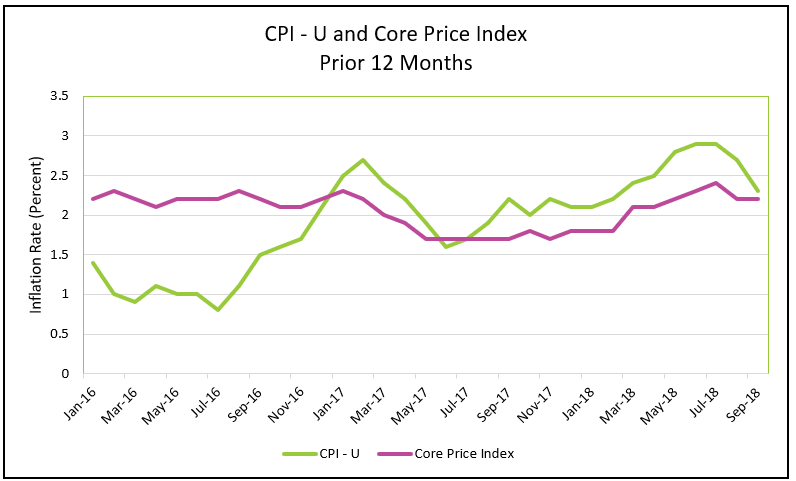
Inflation was less than expected in September. The most common measure of inflation, the CPI – U, increased 0.1% in September after increasing 0.2% in August. The yearly rate of 2.3% is also down and has been falling since July when it peaked at 2.9%. Much of the increase in the summer months could be attributable to higher energy prices. However, that does not tell the entire story because the core index also peaked in July, but at 2.4%. The increase in energy prices also explains the widening gap between the CPI and core indexes during summer. A core index is a more reliable measure of inflation when identifying trends because food and energy prices are very volatile.
In a separate report, on October 10th, the BLS reported that
producer prices have increased 2.6% for the past 12 months. There has been a steady increase in the PPI since 2016. (The full report can be accessed at
BLS- Producer Price Index News Release) Changes in producer prices frequently foreshadow changes in the consumer price index because it measures the change in the cost to produce goods and services, which can later be passed on to consumers.
Employment
On October 5th the BLS published its September employment report. The full report can be read by going to
The Employment Situation. Here are the highlights.
- 134,000 workers were added to payrolls in September.
- U – 3 fell to 3.7% in September.
- U – 6 increased from 7.4% to 7.5% but remains historically low.
- Over the past year the average hourly earnings for all employees on private nonfarm payrolls has increased 2.8% to $27.24.
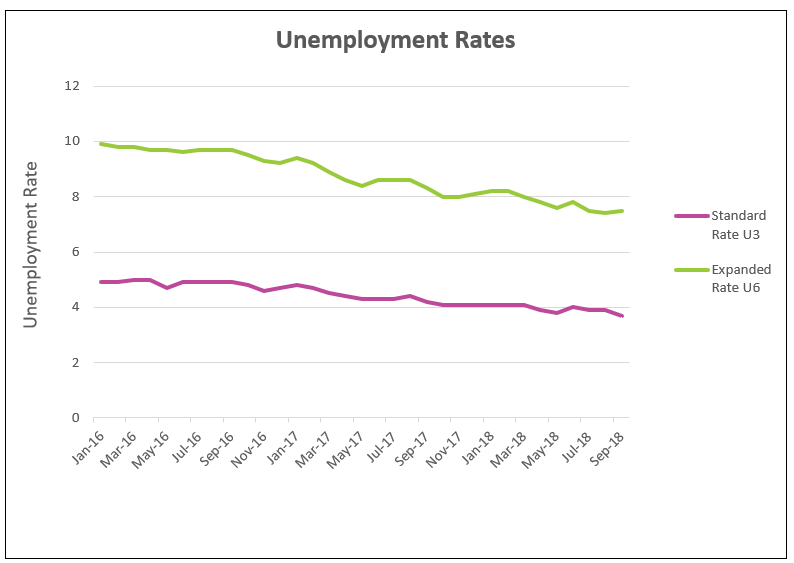
All measures of unemployment remain low. The standard measure of unemployment, the U – 3, fell to 3.7%, the lowest it has been since December 1969. The broader measure U – 6 increased slightly from 7.4% to 7.5%. 134,000 people were added to payrolls in September. While this is the smallest gain in a year, it remains above the estimated 120,000 needed to keep pace with the growing working age population. The BLS’s report noted that employment was probably restrained following Hurricane Florence, particularly in the leisure and hospitality industry. Payroll figures were revised upward for July and August. In July, 165,000 people were added to payrolls. (The initial estimate was 147,000.) August payroll was revised from 201,000 to 270,000. Unemployment among black and African American workers fell from 6.3% to 6%.
Average hourly earnings increased 0.3% or 8 cents in September. Over the past year hourly earnings for all employees on private non-farm payrolls has increased 2.8% to $27.24.
National Debt
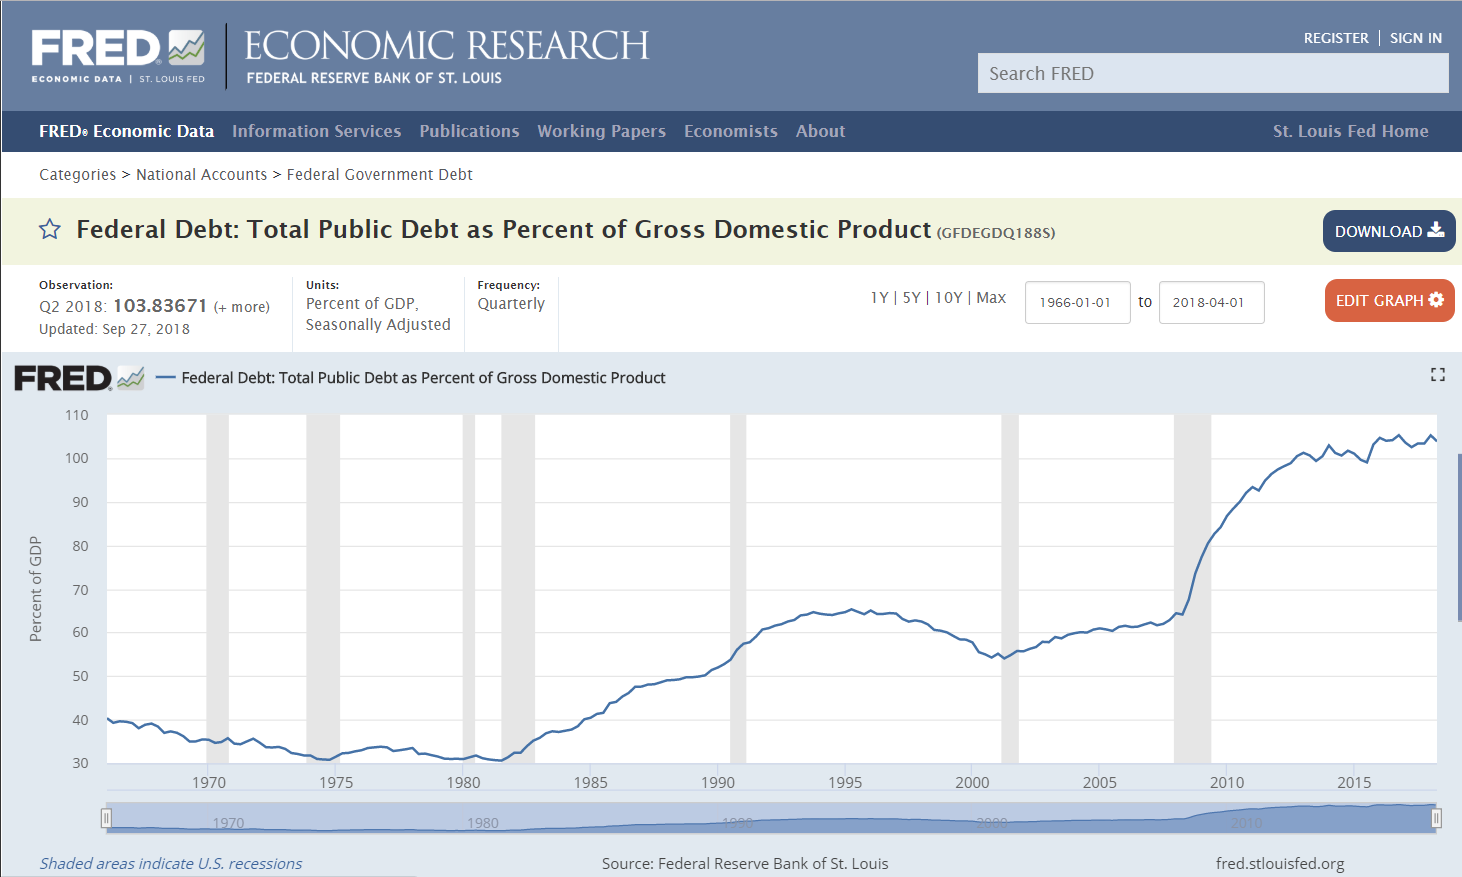
The deficit is growing, but the economy is growing faster, resulting in a drop in the ratio of debt to gross domestic product. The Federal Reserve Bank of St. Louis reported on September 27th that the US federal debt exceeded the nation’s gross domestic product by 3.84% at the end of the second quarter in 2018. This is down from 5.23% in the first quarter. What does this mean? The best measurement for a debt’s affordability, whether it is a family purchasing a new home, a business, or a country, is the relationship between debt and income. The US national debt now exceeds its income and the trend is becoming more alarming. In 2017, Germany’s ratio was approximately 64%, and the UK’s was 88%. Countries that recently had financial problems had higher debt ratios. Greece was estimated at 179% and Italy’s debt ratio equaled 132%. In 2016, Japan's debt to GDP ratio was a whopping 236%. The large debt is one reason the Japanese have had minimal growth for over a decade. (
CountryEconomy.com). To learn more about the US national debt read our free lesson
The Federal Budget and Managing the National Debt. The lesson includes an interactive exercise to help students appreciate the challenge of balancing the budget.
Source:
FRED