
Has the US government pumped too much money into the economy? The federal government sent trillions of dollars to households to supplement their income to boost consumer spending and shorten the COVID-induced recession. Consumer spending rebounded nicely and pushed growth in the real gross domestic product (RGDP) to an annual rate of 6.7% in the second quarter. But the rapid growth exposed weaknesses on the supply side. Businesses have struggled to keep pace. The pace of growth has slowed in the third quarter, mainly because the Delta variant of COVID has slowed the pace of spending and discouraged people from returning to the workforce. The growing demand and supply imbalance has pushed up the inflation rate to the highest it has been in decades. The summary discusses how the quantity theory of money explains why pumping money into an economy without increasing the aggregate supply is inflationary. But first, it is essential to understand the state of the US economy.
The Bureau of Economic Analysis’s third estimate for the second quarter was revised upward for the second month since initially released in July. Larger gains than first reported in personal consumption expenditures contributed to the higher estimate. The drop in government transfer payments constrained the growth in the real gross domestic income (RGDI) during the second quarter.
Consumer spending, or personal consumptive expenditures, rose 12 percent from its depressed level in the first quarter. During the first quarter, containment measures continued to limit economic activity. However, municipalities lifted most restrictions in the second quarter, and people began to get out more. Consumers returned to restaurants and traveled more, propelling the service industries to healthy quarterly gains. Government assistance had also increased income to very high levels, which provided the funds to fuel the growth in consumer spending.
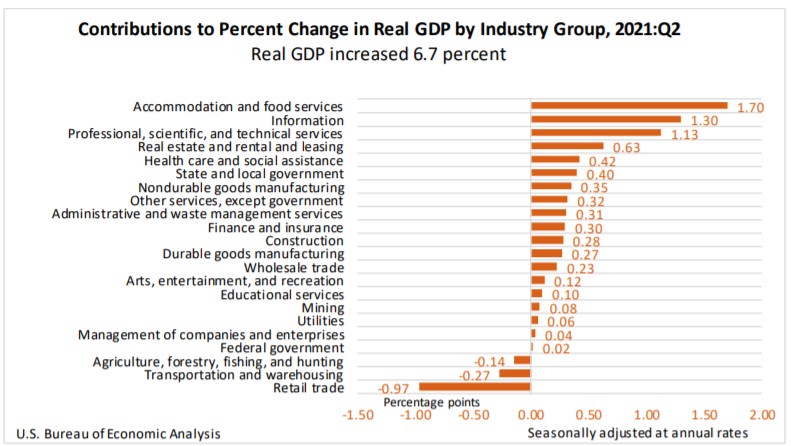
The BEA released its estimates of industry contributions to the rise in GDP. The accommodation and food industry category gained the most because the economy emerged from the constraining measures implemented in the first quarter.
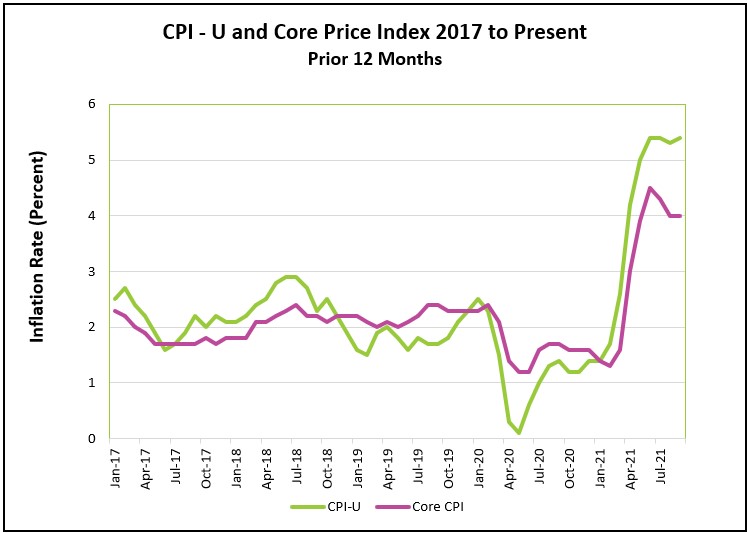
The BEA did not revise its inflation estimates. They remained at their highest levels since 1981 and significantly above the Federal Reserve’s 2% target.
Readers can access the full report at Gross Domestic Product, Third Estimate Second Quarter 2021. Economists and investors are anxiously awaiting the BEA’s advance estimate for the third quarter on October 28th. Most economists and macroeconomic models project that the growth rate will slow in the third quarter because of the Delta variant of COVID-19.
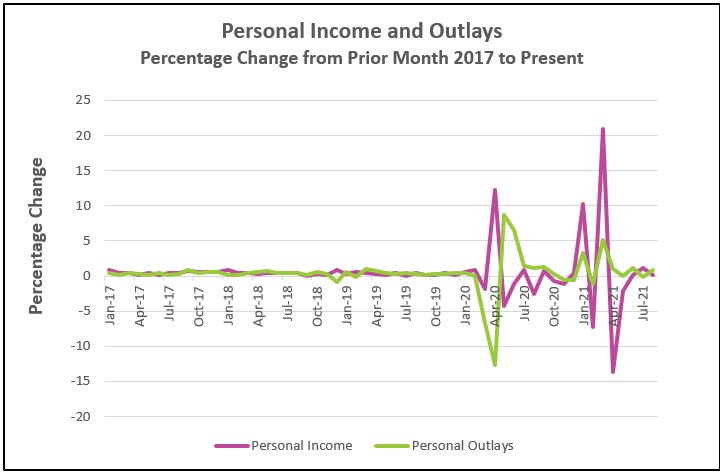
Personal income rose slightly in August, boosted by higher wages and salaries and government transfer payments. But, real disposable income fell in August, which means that after-tax income gains were less than inflation. Buying power suffered. Consumers continued to spend, but the faster spread of the Delta variant of COVID-19 altered spending habits. Consumers sharply increased their buying of small consumer goods such as food for dining at home, furniture, and clothes. Inventory shortages continued to hamper sales in larger ticket items such as motor vehicles.
The increase in demand and supply interruptions continue to push prices higher. Inflationary pressures remained high in August and far exceeded the Fed’s target of 2%. Read the full report Personal Income and Outlays – August 2021. The highlights are listed below.
Prices continue to trend upward. In June, prices jumped 0.9%. Many economists, including those at the Federal Reserve, believed these price increases would dissipate when the supply-chain issues and growing demand returned to normal. They did, temporarily. Gains fell in July and August but escalated again in September. Furthermore, the July and August increases were substantial and exceeded the Federal Reserve’s goal of 2%. September’s annual price gain matched June and July’s record levels.
The consumer price index increased 0.4% in September. Prices of essentials rose at rates exceeding the general price level. Food increased 0.9%. The energy prices were up 1.3%, and the rent of primary residence rose 0.5%. Read the Bureau of Labor Statistics’ release Consumer Price Index – September 2021. The report’s highlights are summarized below.
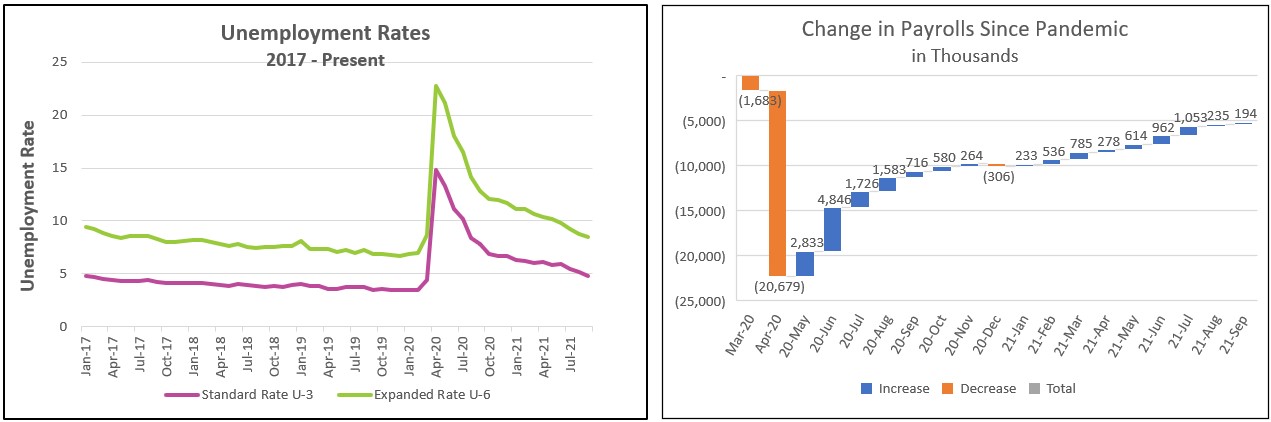
The unemployment rate fell 0.4%, but for the wrong reasons. A person must be seeking employment to be considered unemployed. The highly contagious Delta variant of COVID-19 prompted many people to quit their jobs and deterred others from seeking employment, as evidenced by a fall in the labor participation rate. Economists were disappointed that only 194,000 people were added to payrolls, the smallest increase in 2021. The median estimate of economists surveyed by Bloomberg was that the economy would have added 500,000 workers. Yet the labor market is tight. Wages are higher because employers are having trouble hiring qualified workers. The highlights from The Employment Situation – September 2021 are listed below.
COVID continues to impact the economy adversely. A surge in cases discouraged Americans from dining out and traveling. Many people were reluctant to reenter the workforce. Personal income rose slightly, but disposable income did not keep pace with inflation, which means households could purchase fewer goods and services in September than in August. Consumers did spend, but growth in spending was significantly less in the third quarter than in the second quarter before the Delta variant of COVID became prevalent.
Meanwhile, businesses continue to have trouble meeting the demand for the goods and services they offer. Supply challenges and an unmet demand increased inflation to the highest rate in years. The cumulative effect is that growth in the real gross domestic product is probably slowing. GDPNow estimates the growth rate has fallen to 1.3%. Economists refer to periods of low growth and rising prices as stagflation, the most harmful type of inflation.
Policymakers’ initial response to the pandemic-induced recession was primarily to flood the economy with money to prevent the aggregate demand from crashing. Households received stimulus checks. The unemployed received supplemental insurance. One objective was to pay families enough to cover any loss in income they had from losing a job. Incomes rose to record levels. Buoyed by the higher incomes and savings, consumers spent, albeit on different goods.
It is time to focus on the supply side to create jobs and lower inflation. Businesses have struggled to keep pace with a growing demand. The labor market is tight. Many companies are having difficulty filling positions. The Bureau of Labor Statistics reported on Tuesday that there were 10.4 million job openings on the last day of August. Employers are increasing wages. Wages are 4.6% higher than a year ago. But the fear of contracting COVID has deterred many potential workers from entering the workforce. In other cases, people approaching retirement age have chosen not to return to the workplace. They enjoy not working and realize they can afford to retire.
Shortages of parts and raw materials have slowed production while increasing production costs. The lack of chips has reduced the production of automobiles. Toyota recently announced it was cutting production 40 percent. Taylor Morrison in Durham, NC, recently put several houses on hold because it could not acquire windows. Many businesses have increased their prices to cover a portion of their growing expenses resulting from shipping bottlenecks, material shortages, labor shortages, and higher commodity prices. Economists refer to this as cost-push inflation.
Most economists believed the supply issues would have corrected themselves when the economy reopened. They thought people would quickly return to work. As expected, prices jumped in the industries most affected by the recession because prices fell initially and were returning to where they were. But September’s data show that inflation is broader than the sectors directly impacted by the reopening. For example, in September, food prices rose 0.9%, and rent increased 0.5%.
Focusing more on the supply challenges can reduce inflationary pressures. Here’s why. Money, like all commodities, is subject to the law of supply and demand. An increase in the money supply reduces the price of money (its value). If the value of a dollar decreases, then it takes more dollars to purchase a given item, i.e., inflation occurs. The quantity theory of money uses the formula below to mathematically show how increasing the money supply increases the average price of goods and services (thereby causing inflation) and/or stimulates production.
M x V = T x P
The amount of money in circulation (M) multiplied by the number of times each dollar is used (V) must equal the total amount spent in an economy, which is the price of goods and services (P) multiplied by the number of units sold (T). Assume that the velocity of money does not change significantly. Then any increase in money supply must be reflected in an increase in production (T) and/or an increase in the price level (P).
Government transfer payments such as the trillions of dollars in the stimulus checks and supplemental unemployment insurance payments dramatically increased the money supply. (See the graph below of M1 furnished by the Federal Reserve.) Household incomes rose to record levels, increasing the economy’s aggregate demand. Policymakers hoped the increase would stimulate business activity. It did, but not as much as was expected because of the supply challenges. When the money supply increases and production cannot keep pace, the price level increases.
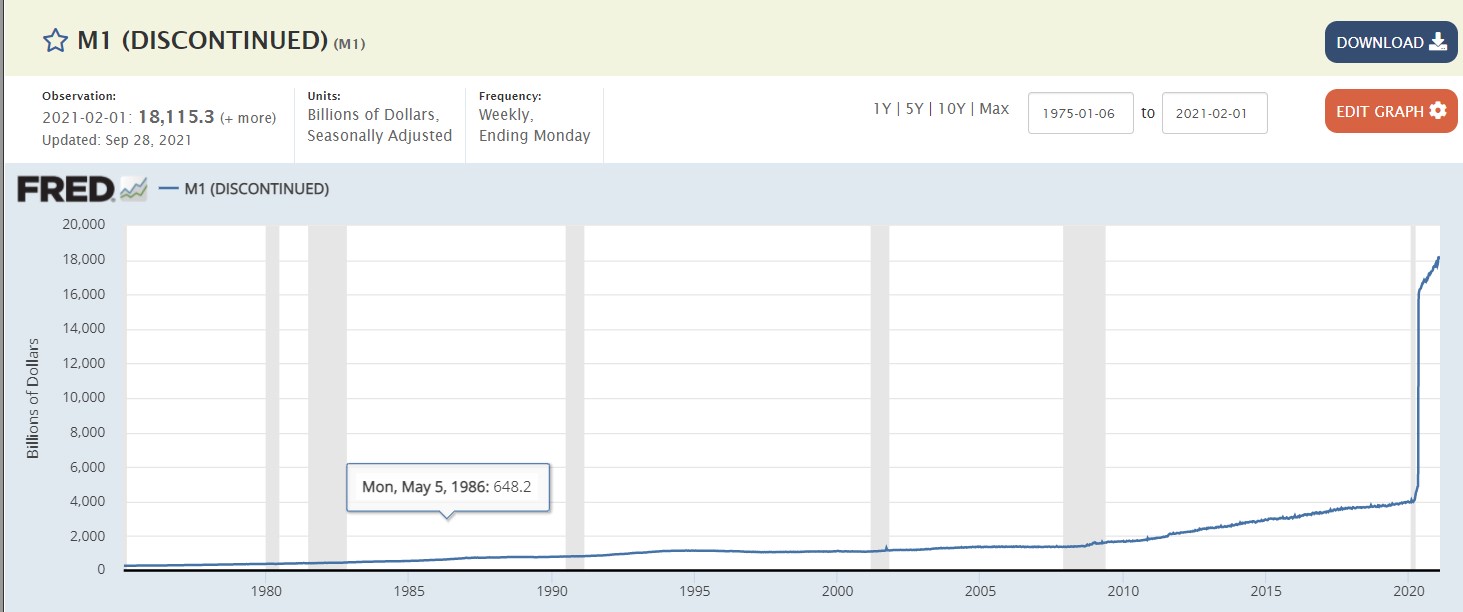
Source Oct. 15, 2021: Federal Reserve FRED
Note that P would not increase as much if T increased. Increasing production (aggregate supply) is essential to easing inflationary pressures. Federal Reserve Chairman Jerome Powell and others have stated that the supply chain issues are temporary, and once they return to normal, inflationary pressures should subside because production will increase.
The Federal Open Market Committee at the Federal Reserve would prefer to tighten monetary policy gradually and maintain low interest rates to help millions return to work. But they may not have that luxury if price increases continue. There is a growing concern that an extended surge in the price level will change consumer expectations and be self-fulfilling because consumers would be more likely to accept price increases and demand higher wages.
Consumers are in a healthy financial position and will continue to drive the economy. Higher wages and accumulated savings should prevent a sharp drop in spending and increase the price level if an increase in the aggregate supply does not match the increase in aggregate demand. The focus on increasing income using transfer payments lessened the impact of the pandemic, but it has also fueled inflation. A long-term solution rests in increasing the aggregate supply rather than the aggregate demand. In the short term, current distribution bottlenecks must be broken. People need to return to work. Most data were taken in the middle of the month when COVID cases were surging. Since then, there has been a decline in cases. Hopefully, a safer environment and higher wages will encourage people to return to work. In the long term, increasing an economy’s production capacity can increase its aggregate supply. Improving our infrastructure and increasing the labor pool are ways the economy can increase its production while minimizing inflationary pressures.
The BEA will release its advance estimate for RGDP in the third quarter on October 28th. Most economists expect a much lower growth rate than in the second quarter, but not as low as the GDPNow is projecting. Inflation will be a growing concern, but the Federal Reserve will probably delay tightening until the fourth quarter of this year or the first quarter of 2022. COVID cases have fallen, so more people will return to work, which will help many businesses increase production. Finally, measures that have already been implemented to improve the distribution channels will help ease the pressure on companies to deliver more of the goods and services they offer.
Stay Healthy