Investors never seem to be satisfied. The economy is healthy, but fears of higher interest rates triggered by mounting inflationary pressures have contributed to the dramatic fall in stock prices and increase in bond yields.
Federal Reserve
Chairman Powell confirmed what most economists believe in his initial testimonies before the House Finance Services Committee and the Senate Banking Committee this week. The economy is healthy and continues to strengthen. The labor market is tightening, inflation is moving closer to the Fed’s target of two percent, the world economy is strengthening, and Congress recently passed tax cuts and spending increases that aggressively stimulate the economy. Taken together, these increase the likelihood that the Federal Reserve will raise rates in 2018, with the first increase coming when they meet in March. Below is a summary of the vital signs of the economy.
Real Gross Domestic Product (RGDP)
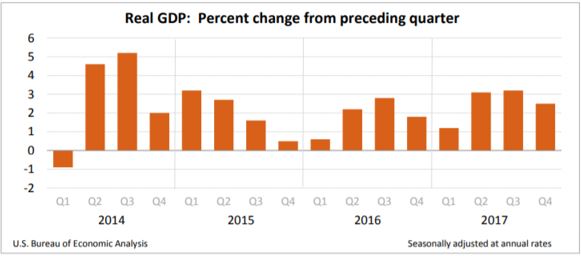
Economic growth was less than President Trump’s goal of 3.0%, but remains above 2.0%, which is more typical this late in a
business cycle.
RGDP slowed to an annual growth rate of 2.5% in the fourth quarter of 2017 according to the
BEA’s second estimate that was released Wednesday. The figure was revised downward from 2.6%. Apparently, businesses drew down their inventories more than estimated in the advance estimate. Consumer spending remains the strongest component of the economy. It increased from 2.2 to 3.8% in the fourth quarter, which is the highest since the second quarter of 2016. 2017 was a good year despite the slower rate of growth in the gross domestic product in the fourth quarter. RGDP increased 2.3% in 2017, up from 1.5% in 2016. (Read the full report at
BEA RGDP 2017 – 2nd Estimate.)
Personal Income and Outlays
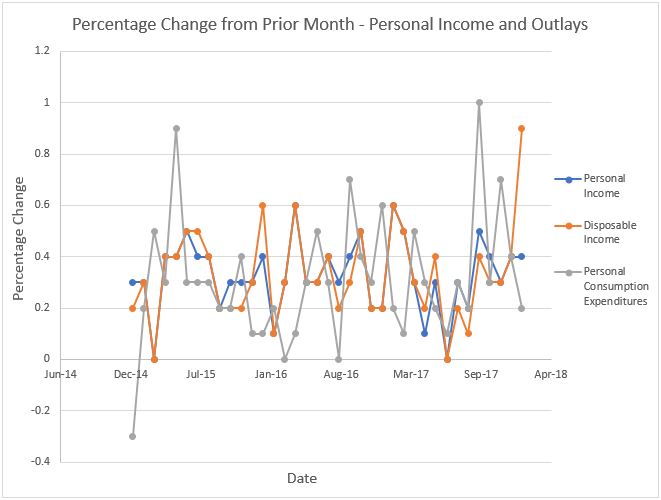
The anticipated increase in income is coming to fruition. The BEA just released January’s
Personal Income and Outlays report. Income, before and after tax, continues to increase. Personal income increased 0.4% in January, for the second month in a row. More importantly,
disposable income rose 0.9%, largely because of the tax savings resulting from the tax bill passed in December. Consumers responded by purchasing more, but not as much as most economists expected. Surprisingly, consumer spending only increased 0.2%, following an increase of 0.4% in December and 0.7% in November. The combination of a substantial increase in disposable income and a modest jump in spending resulted in Americans saving more of their paychecks. The savings rate rose from 2.5% to 3.2%.
The most alarming news was the jump in the
PCE price indexes. The PCE price index increased 0.4%, up from 0.1% in December, and 1.7% for the preceding 12 months. The more important
core price index rose 0.2% in December, 0.3% in January, and 1.5% for the prior 12 months. Economists view the core index as more indicative of future trends because it excludes volatile energy and food prices. The January increases were in the higher range of expectations among economists. The Federal Reserve favors the PCE price index over the more commonly used consumer price index when evaluating
monetary policy. January’s inflation figures remain below the Federal Reserve’s annual target of 2%, but if prices continue to increase at the pace they have for the past two months the inflation rates will exceed the Fed’s target soon.
Consumer Price Index
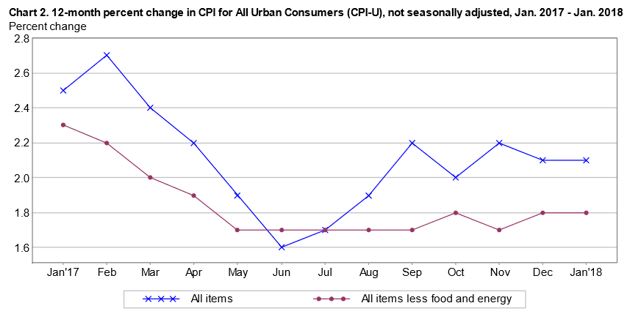
The
Bureau of Labor Statistics reported that prices increased 2.1% during the past 12 months. January’s increase was 0.5%, up from 0.2% in December. The volatile price of gasoline again explained much of the instability in prices between months. In December gasoline prices fell 0.8%, only to increase 5.7% in January. The core index increased 0.3% in January and 1.8% for the past 12 months.
The Bureau of Labor Statistics reported that the
producer price index (PPI) rose 0.4% in January and 2.7% over the past 12 months. This follows a 0.1% decline in December. The PPI measures inflation for suppliers. It is the weighted average cost of a basket of goods and services sold in the wholesale, manufacturing, and commodity markets. The PPI is a
leading indicator and frequently signals future changes in the CPI. Businesses may try to pass some of their cost increases (which is measured in the PPI) through to the final buyer (which is measured in the CPI).
Expect inflationary pressures to increase for several reasons. The labor market is tighter. The weaker dollar will make imports more expensive. Commodity prices are expected to rise because the global economy is gaining strength. Recent legislation reducing the tax rate and high spending deficits should boost the
aggregate demand. Production should also increase, but according to a recent BEA report, the economy is beyond its long-run capacity. If passed, a recently proposed
tariff on aluminum and steel will add inflationary pressures because producers will pass some of the added cost to consumers. Read
Supply and Demand – The Costs and Benefits of Restricting Supply for a detailed analysis of how tariffs increase prices.
Employment
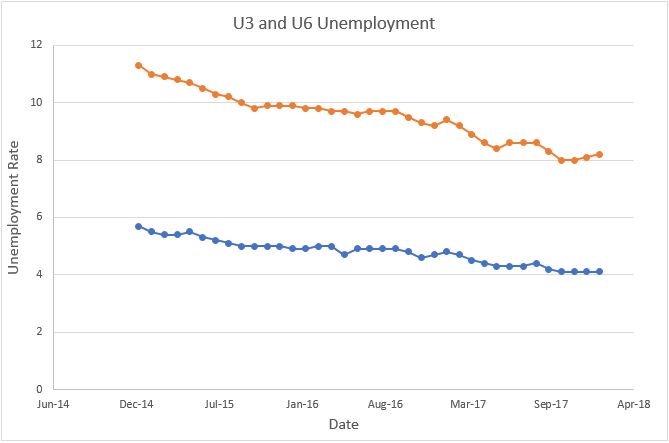
The Bureau of Labor Statistics January report revealed very few changes. The seasonally adjusted unemployment rate remained at 4.1% for the fourth consecutive month. The labor participation rate (62.7%) was also unchanged for the past four months, and the employment-population ratio equaled 60.1% for the third month. 6.7 million people remain unemployed, but 200,000 jobs were added to payrolls. Industries with the greatest gains were: construction (36,000 jobs), health care (21,000 jobs), manufacturing (15,000 jobs), food services and drinking places (31,000 jobs).
Many unemployed are not included in the 4.1% unemployment rate even though they would like to work. People get discouraged and give up the search. Some people may be employed part-time but wish to work full-time. The U6 unemployment rate includes these groups. The U6 increased to 8.2%. Surprisingly, this is the second straight month of a 0.1% increase. (For a discussion of the different types of unemployment read our blog:
Healthy and Unhealthy Unemployment – Who is Included.)
The unemployment rate continues to be below what most economists consider the
full employment rate of approximately 4.5 percent. The tightening of the labor market has pushed wages higher. Wages continued their increase in January. The average hourly earnings equaled $26.74 which is $.09 more than December. This follows a $0.11 increase in December. Average earnings increased 2.9%, or $0.75 higher over the prior 12 months. This is the largest gain since June 2009. It is interesting that the average workweek fell 0.2 hours to 34.3 hours in January. Possible explanations include: the brief government shutdown (although the BLS states it had no effect on employment), or the lack of available workers is restraining the economy from expanding. Most economists believe pressures on wages should continue to increase in 2018.
Read the Bureau of Labor Statistics
Employment Situation Summary.