State of The Economy - July 2019
Last month, the Federal Reserve reduced its target federal funds rate 0.25% as a preemptive strike because it fears the weakening of the economy. Economic growth has slowed, particularly in agriculture and manufacturing where the impact of tariffs hit the hardest. Real gross domestic product (RGDP), the most common measure of economic growth, slowed from 3.1% in the first quarter to 2.1% in the second quarter, causing concern among businesses and investors. The Dow Jones Industrial Average has recently fallen over 1,000 points. However, it is likely the economy’s expansion will persist because consumers continue to spend, people are still being added to payrolls and inflation remains low.
Real Gross Domestic Product (RGDP)
The BEA’s (Bureau of Economic Analysis) second quarter advance estimate of growth in the US economy was published July 26th. The highlights are summarized below. Readers can be access the report at the Bureau of Economic Analysis, Second Quarter Advance Estimate.
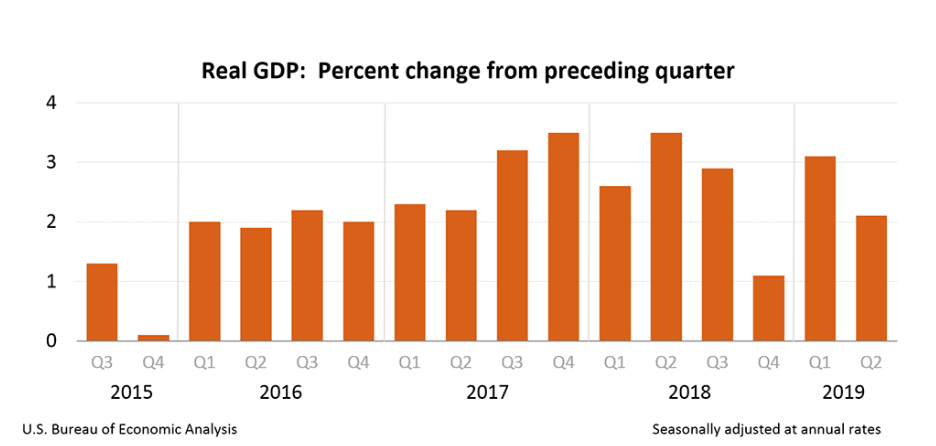
- The BEA estimated that the United States economy’s real gross domestic product (RGDP) grew 2.1%, in the second quarter, down from 3.1% in the first quarter.
- Much of the deceleration of RGDP is attributable to fewer exports and less investment in the private sector. Exports fell 5.2% and gross private investment was 5.5% lower than the first quarter.
- Consumer spending, the largest component of RGDP gained 4.3% in the second quarter. A 5.0% rise in government spending was also a large contributor to the economy’s growth.
Personal Income and Outlays
Consumer spending or personal consumption expenditures (PCE), accounts for approximately 66% of economic activity in the United States. (Read our lesson Gross Domestic Product – Measuring an Economy’s Performance to learn more about the importance of PCE.) Over an extended period, consumer spending is directly tied to household income. Watching the trends in these figures provides important insights into the economy’s health. The Commerce Department released its report Personal Income and Outlays, June 2019 on July 30th. The highlights are listed below.
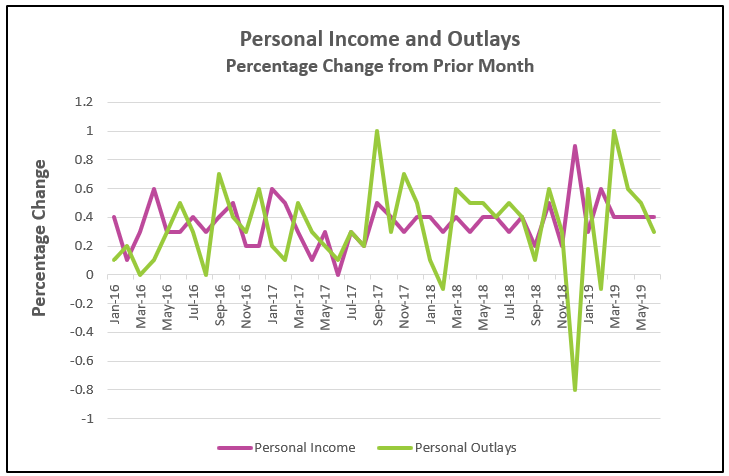
- Consumer spending remains a major force in the economy. It gained 0.3% in June. However, its growth has decelerated during the past four months from a gain of 1.0% in March, 0.6% in April, and 0.5% in May. (May was revised higher from 0.4%.)
- Income continues to outpace inflation. Real disposable personal income, or income after inflation and taxes, increased 0.4% in June. This follows a 0.3% increase in May. An increase in real disposable income means workers’ standards of living are improving.
- Inflation, as measured by the PCE – price index rose 0.1% in June. It has increased 1.4% over the prior 12 months. The PCE – price index is favored by the Federal Reserve when setting its monetary policy. The core price rates, which exclude volatile food and energy prices, equaled 0.2% in June and 1.6% in the prior 12 months. Over the past three months the core price index has increased at an annual clip of 2.5%.
Consumer Price Index (CPI)
Inflation gained momentum in July. The consumer price index increased 0.3% in July, up from 0.1% in June and May. The core index sustained the largest two-month increase since 2006 following its second straight month of increasing 0.3%. Increases equaled 0.1% every month between February and May. Read the Bureau of Labor Statistics’ (BLS) full report by visiting Consumer Price Index – July 2019. Here are the highlights of the BLS report.
- The most quoted measure of inflation, the consumer price index for all urban consumers, CPI - U, increased 0.3% in July and 1.8% over the prior 12 months. The monthly core index also rose 0.3%. Core prices have increased 2.2% over the prior 12 months.
- The difference between the core and CPI – U index can be explained by higher energy prices. Energy prices gained 1.3% following a decrease of 2.3% in June. For the year, energy prices are 2.0% lower.
- Regionally, southern states saw the greatest increase in prices (.03%) in July, while the West had no change.

Employment
Employment conditions in the United States continues to be very healthy. July’s unemployment rate remained 3.7% and 164,000 people were added to payrolls. Readers can access the BLS report by going to The Employment Situation – July 2019. The report’s highlights are listed below.
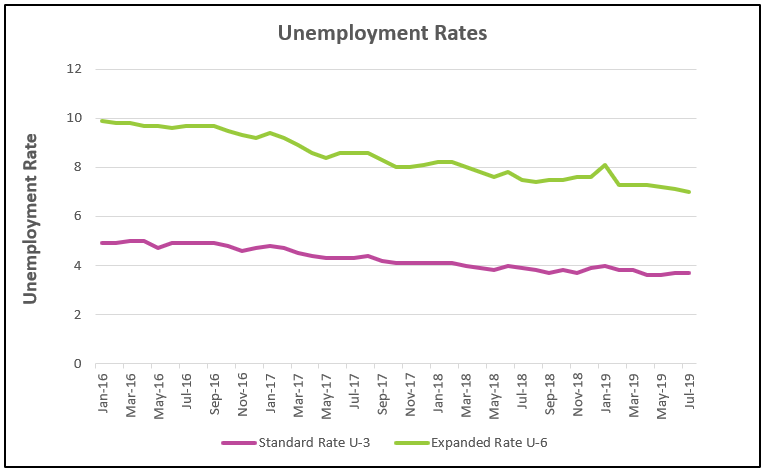
- July’s standard unemployment rate remained at 3.7%.
- The number of people added to payrolls fell from 193,000 in June to 164,000 in July, but remains above the number needed to accommodate population growth. (June’s figure was revised from 224,000.)
- Wages gained 3.2% over the prior 12 months to $27.98, but the average workweek fell 0.1 hour to 34.3 hours. Manufacturing suffered the largest loss of 0.3 hours, but the average workweek was 40.4 hours.
- U-6, the broader measure of unemployment, decreased from 7.2% to 7.0% in July, its lowest level since 2000. The U-6 rate includes part-time workers who would prefer to work full-time and discouraged people who would like a job but gave up looking.
Summary and Analysis
In July, the US economy entered the longest expansion recorded. It has been just over a decade since the Great Recession officially ended. (The National Bureau of Economic Research is the official monitor of recessions. Visit their web site at https://www.nber.org/cycles.html)
How long will this expansion continue? The BEA reported that the pace of economic growth slowed to 2.1% in the second quarter. However, the most important components – consumer spending, disposable income, and job creation – had a positive influence on RGDP. Sustained strength in these areas should bring continued prosperity into 2020 – but at a reduced rate.
But investors are concerned. The stock market has been volatile since the beginning of July. On July 1st, the closing Dow Jones Industrial Index equaled 26,717.43. It rose to a record high of 27,359.16 on July 15th, only to fall to 25,962.44 on August 20th. Why is the market so volatile? Why has the average dropped over 5% in just a little over a month? The expectation of future earnings drives stock prices. Stock prices appreciate following announcements that positively influence the expectation of future earnings. Conversely, prices depreciate when the macroeconomic trends reduce these expectations. (Read Supply and Demand – Understand the Dynamics of The Stock Market.) The economic news has been mixed, which partially explains the market’s volatility. Is the glass half full, or half empty? I will let you decide after reviewing both perspectives.
On the plus side...
- Consumers continue to spend. Personal consumption expenditures (PCE) continues to grow. Consumer spending is the major contributor to the economy because it accounts for over 66% of economic activity.
- Consumer sentiment as measured by the University of Michigan, rose in July. When consumer confidence is high, consumers are more willing to purchase large ticket items. However, the index fell in early August. This drop partially explains the tumbling stock prices in early August.
- Disposable income, which is income after taxes, is increasing. Generally, consumers spend more when disposable income increases because they have more money.
- Real wages are increasing, which means that household income is rising faster than the pace of inflation. As with an increase in disposable income, an increase in real wages increases consumer confidence and consumer spending should increase.
- The employment situation remains the brightest part of the economy. The unemployment rate is near historic lows. Workers continue to be added to payrolls, and people who have struggled to find a job for a long time are beginning to find employment.
- Inflation remains less than the Federal Reserve’s target, but the price level is beginning to increase at a faster clip. A tighter labor market has contributed to the growth in real wages.
On the negative side...
- Consumer confidence was weaker in the first half of August when the index fell to its lowest level since the beginning of the year.
- Consumer spending is growing at a slower pace.
- The global economy remains weak, which reduces the demand for US exports. Exports fell 5.2% in the second quarter. Our largest trading partners have struggling economies. China’s economy grew at its slowest pace in 27 years. European economies are struggling. The European Union grew a mere 1.3% in the second quarter. The British and German economies contracted in the second quarter.
- The trade wars and tariffs continue to adversely affect the US economy. Many companies are beginning to report lower profits. The added cost of tariffs paid by companies for imported raw materials increase manufacturing costs. Added to this hardship is the reduction in the quantity demanded for their exported goods because of the increase in price relative to substitute goods sold by companies from other countries. (Read Supply and Demand – The Costs and Benefits of Restricting Supply to learn more about how tariffs impact consumers and producers.)
- Political uncertainty has added risk to both businesses and investors. Many businesses have postponed investments until they believe the political climate improves. Investors are hesitant to purchase stock because protectionist measures normally reduce profits.
- Manufacturing fell 0.4% in July according to the Federal Reserve’s release, Industrial Production and Capacity Utilization. Problems at Boeing have contributed to the fall but cannot fully account for the 1.5% decrease since December 2018. (Read Fortune’s article, Boeing 737 Max Grounding May Sway U.S. Economic Indicators Including Trade, Durable Goods.)
Future growth in hiring and income will be negatively impacted if businesses remain as cautious as they were in the second quarter. The 2018 tax cuts sparked some investment in 2018 – but since then the business environment has changed. Managers are asking: “When will the US business cycle peak?” “When will the global economies begin to prosper?” “Will the new trade policies be favorable?” Weak global economies have reduced the demand for US goods, while a strong dollar and tariffs have decreased the quantity demanded for exports by increasing the price of US goods sold overseas. (China has recently let the value of the yuan drop.) A stronger US dollar raises the price of US goods higher relative to prices denominated in other currencies. Finally, most countries have retaliated when the US imposed a tariff on items manufactured in another country by charging a tariff on US goods. This raises the price of US goods sold in those countries. These considerations and more have contributed to less capital investment during the second quarter.
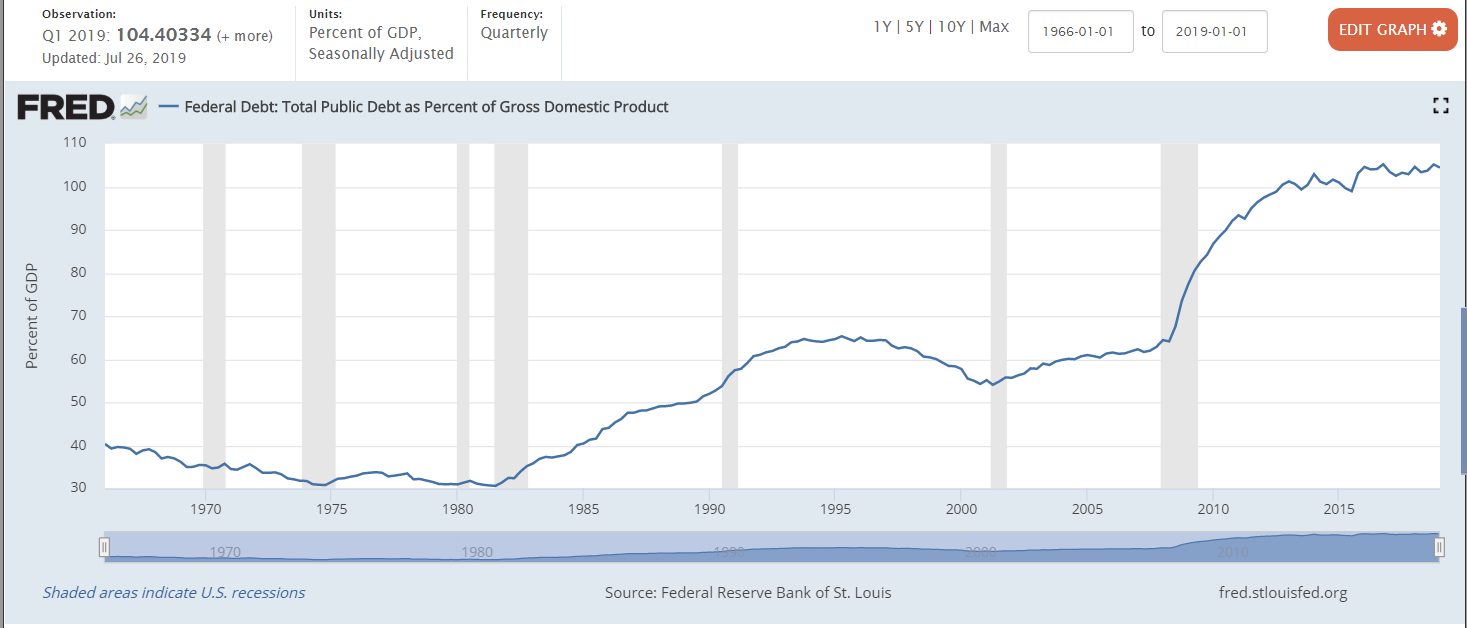
Much of the US economy’s growth has been financed. Government spending increased 5.0% in the second quarter. The US Treasury reported that the budget deficit increased 23% between October and June, prompting the Treasury to warn that the government will run out of money in September unless the debt ceiling is raised. But can the nation afford to continue adding to its debt? The Federal Reserve reported that the national debt is over 104% of the nation’s GDP. This is up from 83% at the end of the recession.